


The most reliable generative AI statistics for 2026 come from a short list of publishers that show their sample and method. Nearly nine in ten surveyed organizations use AI in at least one function. Only 19.8% of all US firms do. In one set of experiments, AI-made ads lifted click-through rates by up to 19%, and an AI label cut them by 31.5%.
Most statistics pages list hundreds of numbers and link to other statistics pages. This one lists 30. Each number has a named publisher, a sample or method, a date and a link to the original.
The numbers cover adoption, advertising, consumer trust, commerce and cost. A last section names three widely repeated figures with no data behind them.
Key Takeaways
- Adoption depends on who you ask. Surveys that skew toward large organizations report use near 90%. The US Census Bureau finds 19.8% across all firms.
- Advertisers report heavy use. 83% of US ad executives say their company uses AI in the creative process (IAB, January 2026).
- Viewers are less positive than advertisers think. 82% of ad executives expect a positive reaction. 45% of young consumers report one.
- People cannot reliably spot synthetic faces. In a peer-reviewed test from 2022, 315 people scored 48.2%, close to chance.
- Forecasts are not measurements. The market size figures here are forecasts, and the tables say so.
How these statistics were chosen
Each number had to pass three checks. We read the original page or paper on 7 October 2026. The publisher states who was asked or what was measured. The publisher gives a date.
Two labels appear in the tables. “Vendor-run” means a company that sells a related product ran the survey or measured its own product. “Forecast” or “estimate” means the number is a model result, and nobody counted it.
We excluded any number we could read only in press coverage. That removed several recent retail traffic figures.
Generative AI adoption statistics
These eight numbers answer one question in different ways: how many organizations and people use AI or generative AI.
| # | Statistic | Who measured it, and how | Source and date |
|---|---|---|---|
| 1 | Nearly nine in ten respondents say their organization regularly uses AI in at least one business function | Online survey, 1,719 participants in 97 nations, 4 May to 8 June 2026 | McKinsey, The state of AI in 2026, August 2026 |
| 2 | 70% of organizations used generative AI in at least one function in 2025 | Annual report that compiles survey data | Stanford AI Index 2026, 2026 |
| 3 | 19.8% of US firms used AI in the previous two weeks | Business Trends and Outlook Survey, sent every two weeks, as of 3 May 2026 | US Census Bureau, May 2026 |
| 4 | 20.0% of EU enterprises with 10 or more employees used AI in 2025, up from 13.5% in 2024 | Official survey of 157,000 enterprises | Eurostat, December 2025 |
| 5 | 9.5% of EU enterprises used AI to generate pictures, video or sound in 2025 | Same survey, by type of AI | Eurostat, December 2025 |
| 6 | 54.6% of US adults aged 18 to 64 used generative AI in August 2025 | Real-Time Population Survey, run each quarter | Federal Reserve Bank of St. Louis, November 2025 |
| 7 | 34% of US adults have used ChatGPT at least once | Panel survey of 5,123 adults, 24 February to 2 March 2025 | Pew Research Center, June 2025 |
| 8 | 34% of people use a generative AI system each week, up from 18% in 2024 | YouGov online survey in six countries, 5 June to 15 July 2025 | Reuters Institute, 2025 |
Row 5 is the closest thing to an official AI image statistic. The Reuters Institute survey in row 8 adds a consumer view: 9% of people generate an image with AI each week, up from 5%.
Why adoption numbers disagree
Row 1 says nearly nine in ten. Row 3 says 19.8%. Both are correct, because they count different things.
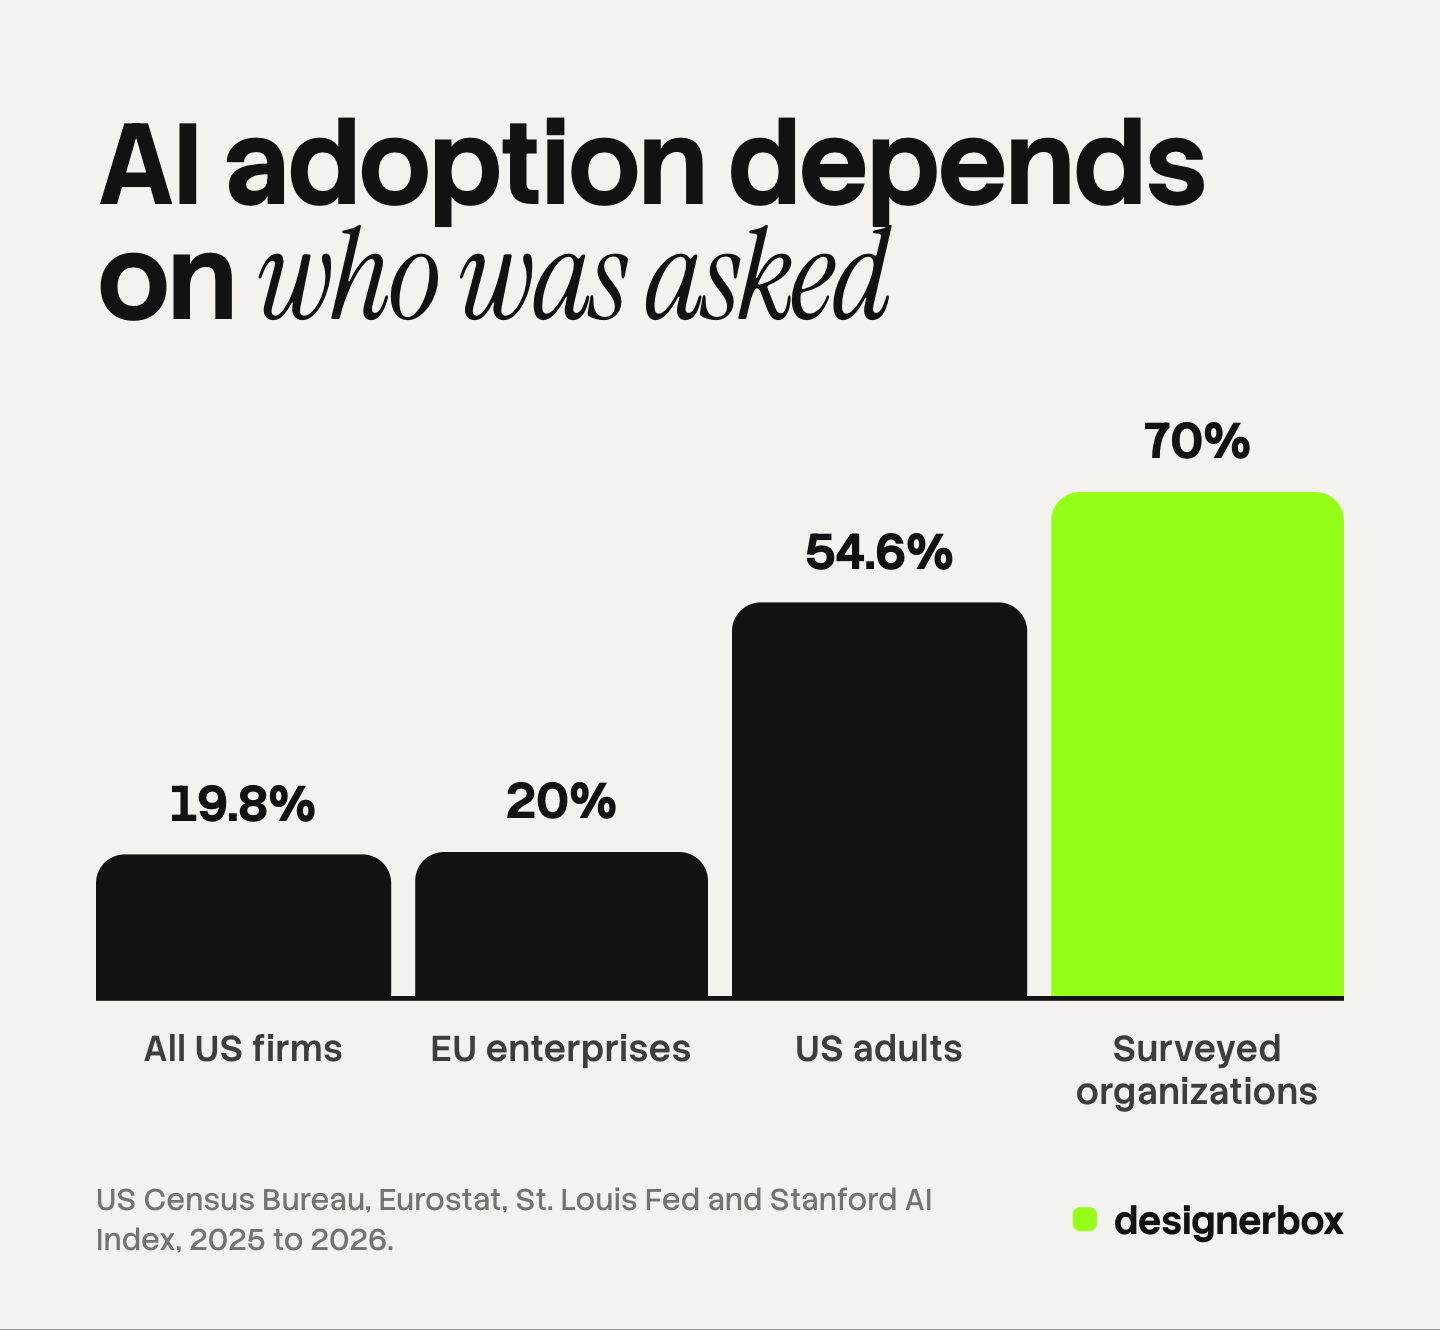
The McKinsey survey reaches people who answer a consulting firm’s survey. More than a third of them work at companies with revenue above one billion dollars. The Census survey reaches firms of every size, and most US firms have a handful of employees.
A Federal Reserve note makes the same point with two surveys. One reports AI adoption of about 18% when each firm counts once. The other reports about 78% when firms are weighted by employment (federalreserve.gov, April 2026). Large firms adopt first, and large firms employ most people.
Before you quote an adoption number, check three things: who was asked, what counted as use, and over what period.
AI advertising and marketing statistics
Advertising has the best evidence, because ad platforms can run controlled tests. The first three rows are surveys. The last five are measured results.
| # | Statistic | Who measured it, and how | Source and date |
|---|---|---|---|
| 9 | 83% of ad executives say their company uses AI in the creative process, up from 60% in 2024 | Survey of 104 US ad executives, October 2025 to January 2026 | IAB, January 2026 |
| 10 | Nearly two in three video ad buyers use generative AI for video creative, up from half in 2025. They expect it in one-third of their ad assets in 2026 | Survey of US video ad buyers. The release gives no sample size | IAB, July 2026 |
| 11 | 75% of marketers use AI to help produce more personalized content | Vendor-run survey of nearly 4,500 marketers | Salesforce, February 2026 |
| 12 | Ads made fully with generative AI raised click-through rates by up to 19% over ads by human experts | Experiments by NYU Stern and Emory researchers | NYU Stern, November 2025 |
| 13 | Telling viewers an ad was made with AI lowered click-through rates by 31.5% | Same study | NYU Stern, November 2025 |
| 14 | Across 4,633 matched ads and more than 369 million impressions, AI images showed no detectable average click-through disadvantage | Working paper on data from one ad network, which also sells an AI ad tool | SSRN, revised August 2026 |
| 15 | Generated backgrounds raised click-through rates by about 15% over the original product images, with a range of 4% to 40% by merchant | A/B tests on retargeting ads, mostly apparel, from September 2023 | Czapp and others, RecSys 2024, August 2024 |
| 16 | Background generation lifts conversions by 2% to 3% on Advantage+ catalog ads | Meta’s own measurement of its own feature | Meta, read October 2026 |
Rows 12 to 16 measure clicks or conversions. None of them is a promise for your account. We review the same studies in more detail in our guide to what the evidence says about AI-generated ads.

Row 11 comes from a company that sells marketing software, so the publisher has an interest in the answer. Our guide to generative AI for marketing covers the rest of that report.
AI image statistics on trust and disclosure
These six numbers describe how people react to AI-made images and ads. They explain why disclosure is a live question for advertisers.
| # | Statistic | Who measured it, and how | Source and date |
|---|---|---|---|
| 17 | 79% of US adults saw an ad in the past 30 days that looked AI-made | Probability panel of 3,270 adults, 4 to 11 May 2026 | Gallup, August 2026 |
| 18 | 49% view the use of AI to create ads negatively. 19% view it positively | Same survey | Gallup, August 2026 |
| 19 | 62% say AI-made people or voices in ads are unacceptable, even with clear disclosure | Same survey | Gallup, August 2026 |
| 20 | 82% of ad executives think young consumers feel positive about AI ads. 45% of those consumers do | 104 US ad executives and 505 US Gen Z and Millennial consumers | IAB, January 2026 |
| 21 | 76% of US adults say it is extremely or very important to tell AI content from human content. 53% are not confident they can | Panel survey of 5,023 adults, 9 to 15 June 2025 | Pew Research Center, September 2025 |
| 22 | People told real faces from AI-made faces 48.2% of the time. With training, they reached 59.0% | Peer-reviewed experiments with 315 and 219 participants | Nightingale and Farid, PNAS, 2022 |
Row 22 is the strongest AI art statistic on this page. It comes from a controlled experiment, where chance is 50%. It also dates from 2022, so it tested an earlier generation of image model.
Rows 13 and 21 point in opposite directions on disclosure. One measured clicks, and a label lowered them. The other asked people, and most said it is important to tell AI content from human content. Our guide to AI disclosure in advertising covers what each platform and law requires. For where each rule sits, read who controls each layer of AI in advertising.
AI in ecommerce statistics
Independent numbers on generative AI in commerce are rare. Most come from companies that run shopping software, so read the method column first.
| # | Statistic | Who measured it, and how | Source and date |
|---|---|---|---|
| 23 | Traffic from generative AI tools to US retail sites rose 693.4% in the 2025 holiday season | Adobe Analytics platform data, more than one trillion visits to US retail sites | Adobe, January 2026 |
| 24 | AI and agents influenced 20% of holiday retail sales | Vendor platform data. The count includes product recommendations | Salesforce, January 2026 |
| 25 | About 14% of US retail trade businesses use AI, below the 19.8% national rate | Business Trends and Outlook Survey, as of 3 May 2026 | US Census Bureau, May 2026 |
| 26 | US consumers get an estimated $172 billion a year in value from generative AI tools | Estimate of consumer surplus, early 2026 | Stanford AI Index 2026, 2026 |
Row 23 is a growth rate from a small base. The publisher says in the same release that the base of users remains modest. A rate near 700% says the channel is new. It does not say the channel is large.
Row 24 counts any sale that an AI feature touched, and that includes ordinary product recommendations. It is not a count of sales made by chat assistants.
Product pages have better evidence than shopping chat does. Our guide to generative AI in ecommerce covers product images. Our review of product video and conversion rate traces the video numbers.
Cost and market size statistics
Three of these four numbers are forecasts or investment totals. They describe money that vendors and investors spend. They do not describe what a brand pays to make an image.
| # | Statistic | Who measured it, and how | Source and date |
|---|---|---|---|
| 27 | Worldwide AI spending will reach $2.59 trillion in 2026, up 47% | Forecast. Infrastructure is more than 45% of it | Gartner, May 2026 |
| 28 | Spending on AI models and platforms will reach $64 billion in 2026, up 63.4% from $39 billion | Forecast of end-user spending | Gartner, July 2026 |
| 29 | US private AI investment reached $285.9 billion in 2025. Generative AI took nearly half of all private AI funding | Compiled investment data | Stanford AI Index 2026, 2026 |
| 30 | About 20% of respondents say AI operating costs limited their AI use. 37% credit AI with some profit impact | Online survey, 1,719 participants in 97 nations | McKinsey, August 2026 |
Rows 27 and 28 come from the same analyst firm and differ by a factor of 40. The first counts all AI spending, and more than 45% of it is infrastructure. The second counts only models and platforms. A market size means nothing until you know what is inside it.
Row 30 is the most useful number for a budget owner. In the same survey, about 6% of respondents were high performers, with at least 5% of profit credited to AI. Wide use and measured return are different things.
Numbers we could not trace
Three figures appear on many statistics pages. We looked for the data behind each one.

“90% of online content will be AI-generated by 2026.” This traces to a 2022 Europol report on deepfakes. The sentence said “experts estimate” and cited a 2020 book. Europol replaced the report in January 2024, and the sentence is no longer in it (europol.europa.eu, read October 2026). It is now 2026, and we found no published count.
“71% of images on social media are AI-generated.” We found this figure only on other statistics pages. None named a survey, a sample or a method. A share of all images on all social platforms is also not something an outside party can count.
“34 million AI images are created every day.” This one has a source. Everypixel, a stock image search company, published it as an estimate that runs to August 2023 (journal.everypixel.com). The article says it rests on assumptions and extrapolation from a few public remarks. It is a rough estimate from three years ago, and many pages quote it as a current count.
DesignerBox for image, ad and video production
The numbers above describe a market where most advertisers already use AI and many viewers distrust what they see. The open problem for a brand or an agency is consistency. Anyone can make an AI picture. Making hundreds that still look like your brand is the hard part.
DesignerBox is AI creative production for brands and agencies. You build a workflow once with your brand rules and your references. A colleague runs it as an app with a form. Batch runs it over a sheet of up to 200 rows, with the same rules on row one and row two hundred.
The brand record holds your logo, colors, fonts, voice and rules, and the workflow reads it on every run. The cost is shown before the run. The full workflow from the first product photo to the finished ad, in one subscription.
DesignerBox does not send finished work to an ad account or a store. You download the results, or send them with a webhook or an S3 step. Every plan below Ultra is one seat. No statistic on this page is about DesignerBox, and we publish no performance figure for it.
Uploading your own photos and the commercial license start on the Pro plan. AI video, virtual try-on, upscaling, the image editor and the video editor start on the Premium plan. Plans and credits are on the pricing page.
There is a free plan, and it runs on sample products. Get started free.
FAQ
What percentage of companies use generative AI?
The share runs from 19.8% to 70%, because each source counts different companies. The Stanford AI Index 2026 reports generative AI in at least one function at 70% of surveyed organizations. The US Census Bureau finds that 19.8% of all US firms used any AI in the previous two weeks, as of 3 May 2026. Surveys that skew toward large organizations give much higher numbers than surveys of all firms.
Do AI-generated ads perform better than human-made ads?
The evidence is mixed. One set of experiments found a click-through lift of up to 19% for fully AI-made ads. A study of 4,633 matched ads found no detectable average click-through disadvantage for AI images. Both studies point to one condition: results were better when the ad did not look AI-made.
Do consumers trust AI-generated images?
Many do not. Gallup found that 49% of US adults view AI-made ads negatively and 19% view them positively. Pew found that 76% think it is important to tell AI content from human content. In the same Pew survey, 53% were not confident they could do so.
How big is the generative AI market?
There is no single answer, because each forecast counts different things. Gartner forecasts $2.59 trillion of total AI spending in 2026, and infrastructure is more than 45% of it. Its forecast for AI models and platforms alone is $64 billion. Both are forecasts made in mid-2026, and both can change.
How can I check an AI statistic before I quote it?
Follow the link until you reach the organization that collected the data. Look for the sample, the method and the date. Check whether the publisher sells a related product. If the trail ends at another statistics page, do not use the number.
Sources
- McKinsey, “The state of AI in 2026: On the road to ROI”, survey of 1,719 participants in 97 nations, in the field 4 May to 8 June 2026. mckinsey.com, published 25 August 2026, read October 2026
- Stanford HAI, 2026 AI Index Report, economy chapter. hai.stanford.edu, read October 2026
- US Census Bureau, “Large Firms With at Least 20 Employees Biggest AI Users”, Business Trends and Outlook Survey data from 14 December 2025 to 3 May 2026. census.gov, published 26 May 2026
- Federal Reserve Board, FEDS Notes, “Monitoring AI Adoption in the U.S. Economy”. federalreserve.gov, 3 April 2026
- Eurostat, “Use of artificial intelligence in enterprises”, data extracted December 2025. ec.europa.eu, read October 2026
- Federal Reserve Bank of St. Louis, “The State of Generative AI Adoption in 2025”. stlouisfed.org, November 2025
- Pew Research Center, “34% of U.S. adults have used ChatGPT”. pewresearch.org, 25 June 2025
- Pew Research Center, “How Americans View AI and Its Impact on People and Society”. pewresearch.org, 17 September 2025
- Reuters Institute for the Study of Journalism, “Generative AI and News Report 2025”, fieldwork by YouGov. reutersinstitute.politics.ox.ac.uk, read October 2026
- IAB and Sonata Insights, “The AI Gap Widens”. iab.com, January 2026
- IAB, release on the 2026 Digital Video Ad Spend and Strategy report. iab.com, 14 July 2026
- Salesforce, State of Marketing, tenth edition. salesforce.com, February 2026
- Salesforce, 2025 holiday shopping data. salesforce.com, January 2026
- NYU Stern, “The AI Advertising Paradox”, research highlight on work by Lee, Todri, Adamopoulos and Ghose. stern.nyu.edu, 6 November 2025
- Exner, Hartmann, Ding, Zhang and Netzer, “AI in Disguise: Quasi-Experimental Analysis of a Large-Scale Deployment of AI-Generated Ads”. papers.ssrn.com, last revised 12 August 2026
- Czapp, Jani, Domián and Hidasi, “Dynamic Product Image Generation and Recommendation at Scale for Personalized E-commerce”, RecSys 2024 industry track. arxiv.org, 22 August 2024
- Meta, Advantage+ creative page. facebook.com/business, read October 2026
- Gallup, “Americans Aren’t Sold on Businesses Using AI in Advertising”, 2026 Bentley University-Gallup Business in Society survey. news.gallup.com, 19 August 2026
- Nightingale and Farid, “AI-synthesized faces are indistinguishable from real faces and more trustworthy”, PNAS, 2022. pmc.ncbi.nlm.nih.gov, read October 2026
- Adobe Analytics, 2025 holiday shopping season release. news.adobe.com, 7 January 2026
- Gartner, worldwide AI spending forecast. gartner.com, 19 May 2026
- Gartner, worldwide AI platforms and models forecast. gartner.com, 20 July 2026
- Europol Innovation Lab, “Facing reality? Law enforcement and the challenge of deepfakes”, 2022 edition and the version published in January 2024. europol.europa.eu, read October 2026
- Everypixel Journal, AI image statistics estimate (journal.everypixel.com, August 2023)
- DesignerBox plans and feature gates: DesignerBox pricing page (designerbox.ai/pricing), October 2026
Every statistic was read on the original publisher’s page or paper on 7 October 2026. The McKinsey, Gartner, Eurostat, St. Louis Fed and SSRN pages were read through archived copies of the same pages. Survey figures are self-reported. Forecasts and estimates are labeled in the tables. Individual results vary.