


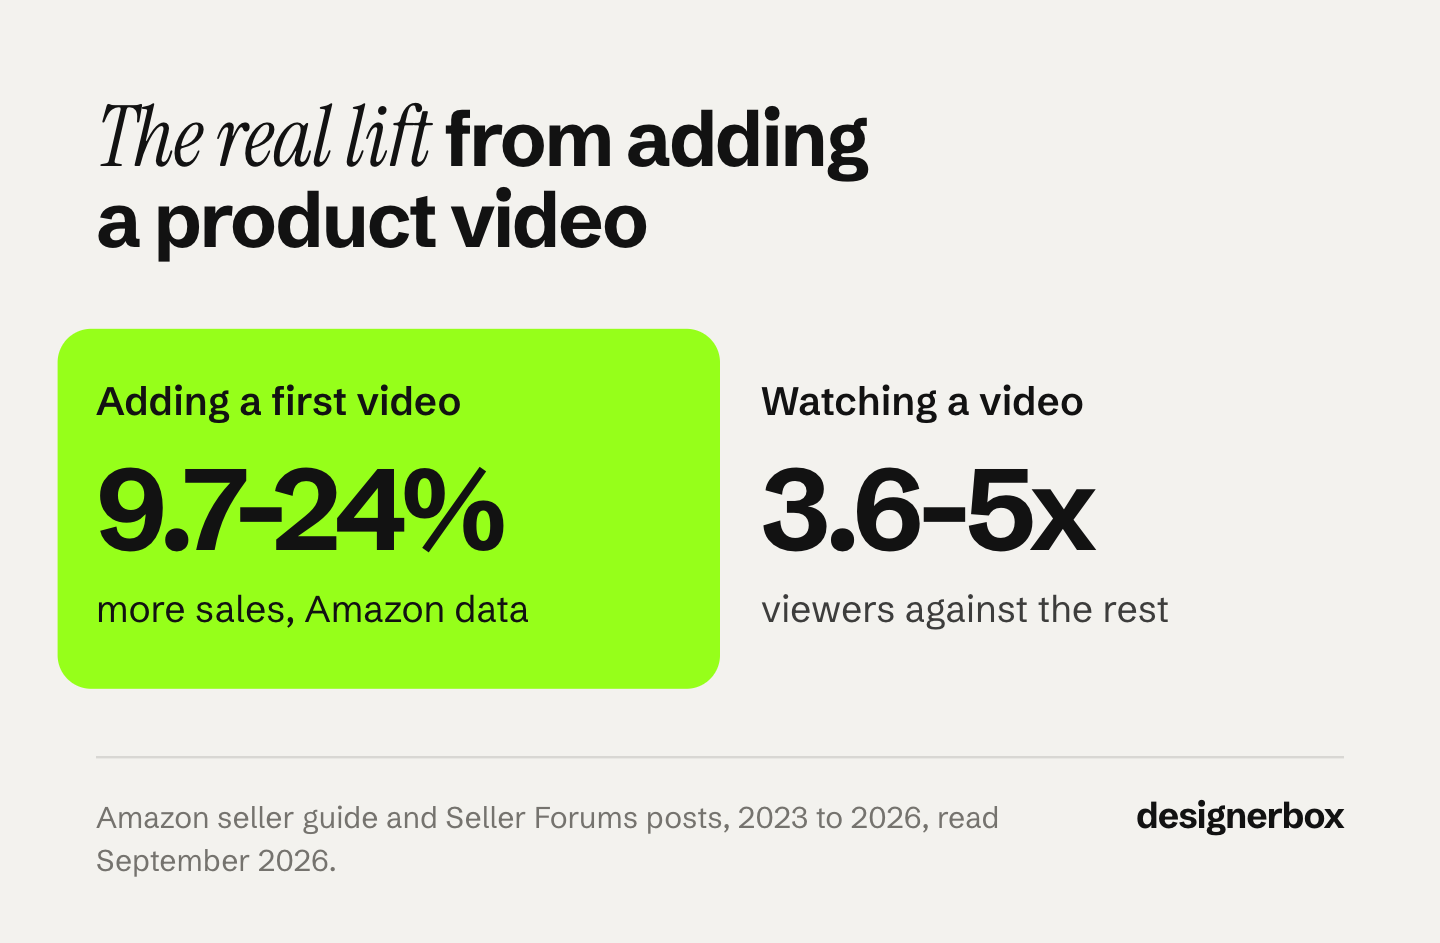
Product videos do increase conversions, but by less than most video conversion rate statistics claim. Amazon’s newest data shows an average 24% sales increase for product pages that added their first video. An older Amazon study put the lift at up to 9.7%. The famous “5x” figure measures something else: shoppers who chose to watch, against shoppers who did not. Budget for a lift, not a multiple, and test it.
Search “product video statistics” and you get the same numbers on every page: 73% more likely to buy, 144% more add-to-carts, 80% more conversions, 5x conversion. Most pages give no year and no method. The 73% figure is twelve years old. Two of the others compare groups of shoppers who were never alike.
This guide traces each number to its source, explains what it measures, and shows which videos move the number that matters. It is written for brands with 20 to 500 products, and for the agencies that make product pages for them. If you already know you want video on every product page, the AI video ads page shows how to make them from one product photo.
Key Takeaways
- The honest lift is a percentage, not a multiple. Amazon reports an average 24% sales increase for pages that added a first video (January to June 2026 data), and up to 9.7% more seller revenue in an older 90-day study.
- “Viewers convert 5x more” measures the shopper. Shoppers who press play were already more interested. Amazon’s own number for the same comparison moved from 3.6x to 5x between two posts.
- Most famous statistics are surveys. The 73% figure is a survey of 1,014 US consumers, published in 2014. The 85% figure is a survey of 266 people, run by a video production company.
- Usage video beats appearance video. In two controlled experiments, a video of the product in use raised purchase intent more than a video of how it looks.
- Placement decides who watches. Baymard found that 41% of test users watched product videos, and that 35% of major sites placed them where users could miss them.
- Test the page, not the viewer. Add video to half of a product group, keep the other half as a holdout, and compare page conversion over the same weeks.
What is a video conversion rate?
A video conversion rate is the share of video viewers who then buy. You count the orders from people who watched, and divide by the number of people who watched. It is easy to report, and most video players show it. The number that tells you whether the video earned its place is a different one: the conversion rate of the whole page, with the video and without it.

The two numbers answer different questions. The viewer rate asks: do people who watch buy more? The page rate asks: does adding the video make more people buy? Only the second one is a return on the video. Most product video statistics report the first one.
Do product videos increase conversions?
Yes, and Amazon has published the two most useful numbers. Its newest figure: product detail pages that added their first shoppable video saw an average 24% increase in sales, compared with pages without video (sell.amazon.com, Amazon internal data, January to June 2026).
An older Amazon study measured the lift after a seller added a video where there was none before. Third-party seller revenue rose by up to 9.7% over a 90-day window, on 2022 US data (Amazon Seller Forums, March 2024). An April 2023 post gave the same 9.7% figure.
Read both with care. Amazon does not say how it matched the pages with video against the pages without. Sellers who add video may also run better listings in other ways, which would raise the 24%.
The 9.7% is the top of a range, with no average published. Both are Amazon’s own studies, and Amazon wants sellers to upload video. Even so, they are the largest measurements of real sales that any marketplace has published.
A lift in that range is worth having. On a product that sells 200 units a month, 10% is 20 more orders every month. The video costs you once. The lift repeats every month the product stays live.
Why viewer statistics overstate the lift
Shoppers who press play on a product video chose to watch. That choice says they are interested, and many are close to a decision. They would buy at a higher rate with or without the video. So when a report says viewers convert more, part of that gap is the video and part is the shopper.
Amazon’s own posts show the problem. In April 2023 a Seller Central post said shoppers who view videos are 3.6x more likely to convert than shoppers who do not (Amazon Seller Forums, April 2023). In March 2024 the same comparison, on January to July 2023 data, said 5x. The videos did not get five times better in a year. The group of viewers changed.
The same posts carry both numbers side by side. Adding a video: up to 9.7% more revenue. Watching a video: 3.6x or 5x more conversion. The first number measures the video. The second number mostly measures the shopper.
The 144% figure has the same shape. It is credited to StacksandStacks.com, a home storage retailer, and it compares customers who watched a product video with those who did not (getshogun.com, September 2026). No year and no study come with it on the pages that repeat it.
Where the famous product video statistics come from
Every number below is real in the sense that someone published it. What each one measures is the part that gets lost.
| Statistic | Source and date | What it measures |
|---|---|---|
| 24% more sales, on average | Amazon internal data, January to June 2026 | Pages with a first video against pages without |
| Up to 9.7% more sales | Amazon study, 90 days, 2022 US data | Revenue before and after a first video is added |
| 3.6x, then 5x, more likely to convert | Amazon data, posts from 2023 and 2024 | Viewers against non-viewers |
| 144% more add-to-carts | StacksandStacks.com, no year given | Viewers against non-viewers |
| 73% more likely to buy | Animoto survey, 1,014 US consumers, published 2014 | What people say they would do |
| 85% convinced to buy by a video | Wyzowl survey, 266 respondents, late 2025 | What people remember doing |
| 80% more landing page conversions | Credited to Depositphotos, no year given | No method given |
The 73% figure comes from the Animoto Online and Mobile Video Study. Animoto surveyed 1,014 US adults in December 2013 and published the result in March 2014 (Animoto on PR Newswire, March 2014). It records what people said they were likely to do. It is twelve years old, and it predates short vertical video.
The 85% figure is from the Wyzowl State of Video Marketing 2026 report, which surveyed 266 respondents in late 2025, split between marketers and consumers (wyzowl.com, September 2026). Wyzowl makes explainer videos. The same report says 83% of video marketers believe video has directly increased their sales. Both are self-reports, from a small sample.
The 80% landing page figure is the hardest to trace. One video studio credits it to a study by Depositphotos, a stock-image company, with no year and no link (rockethousepictures.com, September 2026). Other pages repeat it with no source at all. If you cannot find the study, do not put the number in a business case.
Which product videos move conversion
Not every product video does the same job. A study in Frontiers in Psychology ran two controlled experiments, with 144 participants on electric kettles and 188 on canvas shoes (Frontiers in Psychology, 2022). Each group saw either a video of the product’s appearance or a video of the product in use.

The usage video raised purchase intent more than the appearance video, for both products. The researchers found the main reason was mental imagery: a usage video helps the shopper picture owning the product. A slow turn of the product on white explains the product. A hand pouring the kettle lets the shopper imagine using it.
The same study found a condition. When the product’s rating was low, the type of video made no significant difference. A video does not rescue a product that reviewers do not trust. It helps most where the reviews are already good.
Placement matters as much as content. In Baymard’s product page testing, 41% of users watched product videos, and many missed videos they would have watched because the thumbnail looked like a photo (baymard.com, May 2019). Baymard found that 35% of major ecommerce sites got these details wrong. Give the video thumbnail a clear play icon, and put it in the image gallery where shoppers already look.
So a short brief for a product page video:
- Show the product in use, in the hands of a person or in the room where it lives.
- Put it in the gallery, second or third, with a play icon on the thumbnail.
- Start with the product, because many shoppers watch only the first seconds.
- Start with your best-reviewed products, where the research says video helps most.
For seven beat-by-beat formats, see ecommerce product video frameworks. For the order of the stills around the video, see the six-slot PDP image order. For what the clip should contain shot by shot, see six rules for AI product video. Video is one of six formats a shopper uses to judge a product, and visual commerce sets out what each one needs. For the ad side of the same question, see how product video moves the four numbers behind ROAS.
How to measure the lift on your own store
The only lift that matters is the one on your products, with your shoppers. You can measure it without special software. The method copies what Amazon did: compare pages before and after, and keep a group without video.
- Pick one product group of 20 or more similar products, with steady traffic.
- Split it in two. Add video to half. Leave the other half as it is.
- Run it for 4 to 12 weeks. Amazon used 90 days. Short tests catch noise, not the effect.
- Compare page conversion, orders divided by product page sessions, for both halves. Ignore the viewer conversion rate your video player reports.
- Check returns too. Amazon’s 2024 seller video guide says video can reduce returns by more than 40%, but the guide gives no method for that figure (Amazon Shoppable Videos guide, June 2024). Measure yours.
If the half with video converts better by a few percent and returns stay flat or fall, roll video out to the rest of the catalog. If there is no difference, change the video type before you drop video. An appearance clip may be doing the job a photo already did.
The test has one cost that is easy to miss. It needs a video for every product in the test half, all made to the same standard. If each video is a separate shoot, the test itself becomes the expensive part. For marketplace formats and specs, see Amazon listing videos made with AI and affordable AI video for product listings.
One video standard for every product
Anyone can make an AI picture. Making hundreds that still look like your brand is the hard part. The same is true for product video. The conversion test above only works if every video in the test half follows one brief, with the same framing, the same length and the same brand rules.
DesignerBox is AI creative production for brands and agencies. Scale your images, ads and video with AI and keep your brand on every piece: build the workflow once with your brand rules, run it on every product, see the cost before each run, and keep everything from the first product photo to the finished ad in one place.
You build the usage clip once as a workflow, from one product photo. A saved workflow runs the same way on the next product, and batch runs it over the whole sheet at once. You keep or discard each result, and re-run one row alone. The video editor adds captions, text and audio on a real timeline.
An 8-second clip costs 40 to 560 credits, depending on the model, and you see the cost before each run. AI video starts on the Premium plan. Plans and credits are on the pricing page. The full workflow from the first product photo to the finished ad, in one subscription.
A free plan for your first run
The free plan runs on sample products and cannot make video. Start from a template and see the cost before you run it. Get started free.
FAQ
Do product videos increase conversion rates?
Yes, by a percentage rather than a multiple. Amazon reports an average 24% sales increase for product pages that added a first video, on January to June 2026 data. An older Amazon study found up to 9.7% more seller revenue over 90 days. Figures such as 5x compare viewers with non-viewers and overstate the effect of the video.
What is a good video conversion rate for ecommerce?
There is no reliable benchmark, because the viewer conversion rate depends on who chooses to watch. Compare page conversion with and without video on your own products instead. That comparison shows what the video adds.
Why do shoppers who watch product videos convert more?
Most of the gap comes from who watches. Shoppers who press play are already interested and close to a decision. Part of the gap is the video, but a viewer statistic cannot tell you how much.
What type of product video converts best?
A video of the product in use. In a 2022 study published in Frontiers in Psychology, usage videos raised purchase intent more than appearance videos for both products tested. The difference disappeared when the product had a low rating.
How long should a product page video be?
Short enough that the product appears in the first seconds, because many shoppers stop early. Marketplace limits differ, so check the platform spec before you cut. Our guide to making a product video without a studio covers length by format.
Is the “73% more likely to buy” statistic still valid?
It comes from an Animoto survey of 1,014 US consumers, published in 2014. It records what people said they would do, not what they did. Treat it as dated sentiment, not as a measured conversion lift.
Sources
- Amazon, “Amazon product videos” seller guide (24% average sales increase, Amazon internal data, January to June 2026): sell.amazon.com (accessed September 2026)
- Amazon Seller Forums, “Uploading detail page videos: the basics”, March 2024 (9.7% revenue lift on 2022 US data, 5x viewer conversion on January to July 2023 data): sellercentral.amazon.com (accessed September 2026)
- Amazon Seller Forums, “How to upload detail page videos”, April 2023 (9.7% revenue lift, 3.6x viewer conversion): sellercentral.amazon.com (accessed September 2026)
- Amazon, Amazon Shoppable Videos seller guide, June 2024: m.media-amazon.com (accessed September 2026)
- Cheng, Shao and Zhang, “Effect of Product Presentation Videos on Consumers’ Purchase Intention”, Frontiers in Psychology, 2022: frontiersin.org (accessed September 2026)
- Baymard Institute, “UX Research on Product Page Videos”, May 2019: baymard.com (accessed September 2026)
- Wyzowl, State of Video Marketing 2026: wyzowl.com (accessed September 2026)
- Animoto, “Animoto Survey Finds Pent-up Consumer Demand for Business Videos”, 13 March 2014 (sample of 1,014, fielded 26 to 30 December 2013): prnewswire.com (accessed September 2026)
- StacksandStacks.com 144% add-to-cart figure, as reported by Shogun (getshogun.com/learn/ecommerce-product-videos, September 2026)
- 80% landing page figure, as credited by Rockethouse Pictures (rockethousepictures.com/blog/how-videos-increase-conversion-rates.html, September 2026)
- DesignerBox plans and the video credit range: DesignerBox pricing page (designerbox.ai/pricing), September 2026
Product video statistics traced to Amazon’s seller posts and guide, a peer-reviewed study, Baymard’s usability research, and the original survey reports as of September 2026. Amazon’s 24% figure was re-checked on its seller guide on 2 October 2026. Survey figures are self-reported and are not measured conversion. Individual results vary.