


SKU proliferation is the growth of a catalog through new colors, sizes, bundles and line extensions, at a pace that adds cost faster than it adds sales. The known costs are inventory, storage and forecasting. A less counted cost is content. Every new SKU that looks different needs its own images, and often its own copy and ads, before it can sell.
This guide covers what SKU proliferation is, what causes it, what it costs and how to manage it. It then counts the content cost and gives a tiering model for the image budget. It is written for brands with 20 to 500 products, and for their agencies.
Key Takeaways
- The definition. SKU proliferation is catalog growth that adds complexity faster than it adds sales. Colors, sizes and line extensions are the usual source.
- The research is mixed, and that is useful. One study found that sales rise with variety at first and then fall. Another found that sales rose an average of 11% after an online grocer cut low-selling SKUs.
- The content cost multiplies with color. In our illustrative example, 50 products in 4 colors at 5 images each need 1,000 images.
- Four tiers cut the image count. The same example drops from 1,000 images to 500 when each SKU gets the set its status earns.
- The two reviews belong together. Run SKU rationalization before image production, so no image is made for a SKU that is leaving.
What is SKU proliferation?
A SKU, or stock keeping unit, is one sellable version of a product. A shirt in blue, size medium, is one SKU.
SKU proliferation is the fast growth of that list. Shopify defines it as “the rapid expansion of a company’s product catalog by adding many new stock-keeping units (SKUs) in new colors, sizes, and variations of existing products” (Shopify, December 2025, read October 2026).
Three related terms:
- Product assortment is the full set of products a brand or store sells.
- Product line extension is a new version of an existing product under the same brand: a new flavor, color, size or format.
- SKU rationalization is the regular review that decides which SKUs to keep, change or retire.
Catalog growth is healthy when each new SKU earns more than it costs. Proliferation is growth that nobody has checked.
What causes SKU proliferation?
Most new SKUs are added for a good reason. No single decision controls the total.
- Variants multiply. Options multiply each other. Five colors and six sizes make 30 SKUs from one product. The platform does not stop you: a Shopify product can hold up to 2,048 variants (Shopify developer changelog, October 2025, read October 2026).
- Line extensions feel safe. A new color of a product that already sells looks like low risk.
- Channels ask for their own versions. A marketplace bundle and a wholesale pack can each become a separate SKU.
- Seasons and suppliers add options. Limited editions, gift sets and new supplier styles join the catalog, and some never leave it.
- Nobody owns the total. Several people can add a SKU, and nobody has the job of removing one.
This pattern is old. In 1994, John Quelch and David Kenny named three risks of line extension that is not well managed: “hidden cost increases, weakened brand images, and troubled relations with distributors and retailers” (Harvard Business Review, September 1994, read October 2026).
What SKU proliferation costs
The costs fall into five groups. Four are well documented.
| Cost | Where it appears | Source |
|---|---|---|
| Inventory and storage | More SKUs need more shelf space, and slow ones hold cash | Shopify, December 2025 |
| Forecasting | Demand is harder to predict when sales are split across many SKUs | Shopify, December 2025 |
| Service level | Fill rates fall as variety rises | Wan, Evers and Dresner, 2012 |
| Margin and brand | Complexity costs multiply, and the brand image can weaken | Gottfredson and Aspinall, 2005. Quelch and Kenny, 1994 |
| Content | Every SKU that looks different needs its own images, copy and ads | This guide, illustrative arithmetic |
Service level and sales. Wan, Evers and Dresner studied three years of weekly data from 108 distribution centers of a large soft drink bottler. Fill rates fell as product variety rose. Sales rose with variety at first, at a slowing rate. Beyond a certain level, more variety led to lower sales (Journal of Operations Management, 2012, read October 2026).
Margin. Mark Gottfredson and Keith Aspinall of Bain wrote that the number of offerings that gives the best revenue and profit is, for most firms, “considerably lower than the number they offer today”. New products and line extensions add complexity, and margins shrink as that cost multiplies (Harvard Business Review, November 2005, read October 2026).
What a cut can do. Boatwright and Nunes studied an online grocer that cut SKUs in 94% of its categories, mostly low sellers. Sales rose an average of 11% across the 42 categories they examined, and 75% of households spent more after the cut (Journal of Marketing, July 2001, read October 2026). This is one grocer in one period. It shows that a cut can help. It does not forecast your store.
The same paper adds a warning. Shoppers welcomed the removal of redundant items, but they reacted in different ways to the removal of sizes. Cut duplicates, and protect the options shoppers choose by.
The content cost of SKU proliferation
A SKU cannot sell online with no picture. Shopify’s guide lists six challenges, from storage cost to cash flow, and content production is outside its scope. This cost also grows in a different way from storage.
Google states the rule plainly for product listings. Its image guidelines say: “Don’t reuse one general photo across different product variations. Provide a separate, dedicated image for every SKU that highlights its specific features” (Google Merchant Center Help, read October 2026).
Here is the arithmetic. It is illustrative. Replace the inputs with your own.
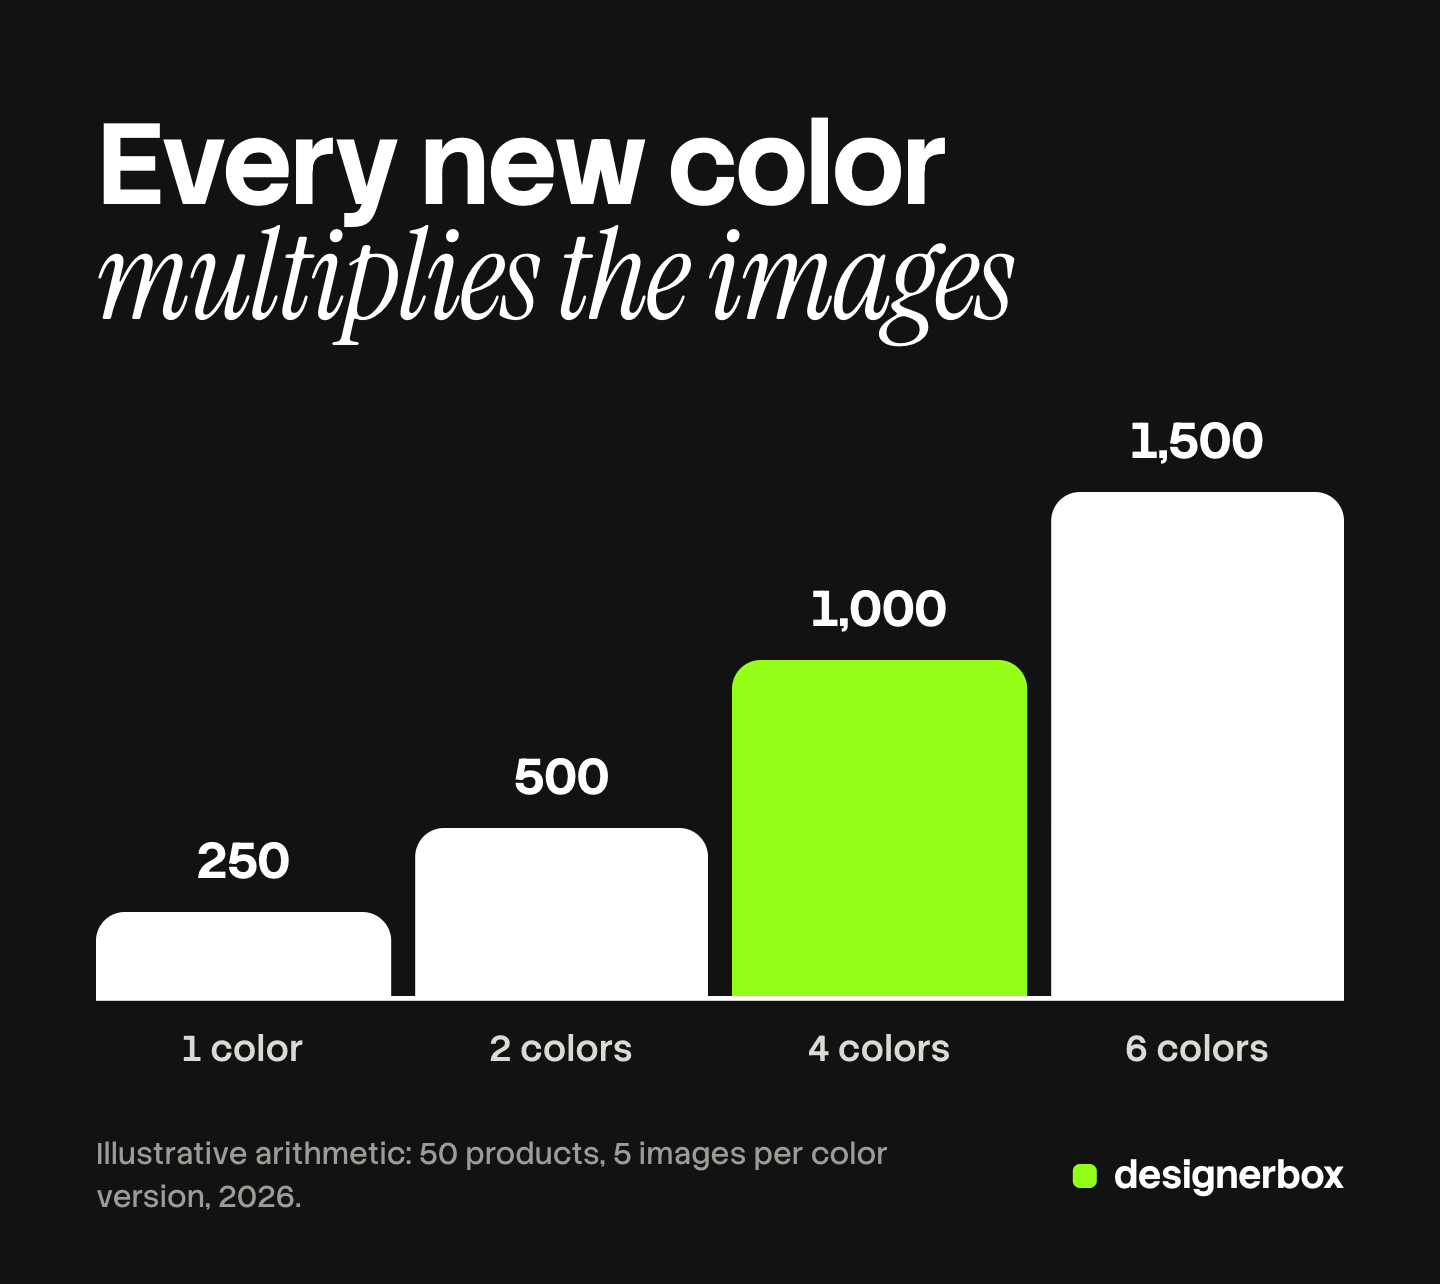
- A brand sells 50 products. Each product gets 5 images. That is 250 images.
- The brand adds a second color to every product. Now 100 color versions need 5 images each: 500 images.
- The brand grows to 4 colors: 200 color versions, and 1,000 images.
- At 6 colors the count is 1,500 images.
The product count never changed. The team that made 250 images now needs 1,500.
Sizes behave in another way. Add five sizes to the 4-color catalog and the SKU count is 1,000. The image count stays at 1,000, because two sizes in one color look the same in a product shot. Our guide to AI product images for Shopify covers this variant math in detail.
So count two numbers: SKUs, and SKUs that look different. Inventory cost follows the first. Image cost follows the second.
Images are one part of the content cost. Each new SKU also needs:
- Product data. A title, a description and an identifier. Under the GS1 standard, any new product requires its own GTIN (GS1 GTIN Management Standard, read October 2026).
- Ad creative. If the SKU is promoted, each ad format needs a version that shows the correct color.
- Upkeep. A new background or a new brand look applies to every image.
Consistency also gets harder with size. Our guide to consistent product images lists the layers a standard has to cover.
How to manage SKU proliferation
- Give the total one owner. One person approves every new SKU and sees the whole count.
- Add a gate for new SKUs. Ask for expected sales, the stock commitment and the content cost, written as a number of images.
- Start with fewer variants. Shopify calls this delayed differentiation: launch a product in a small number of colors and add more when demand is proven (Shopify, December 2025).
- Run SKU rationalization on a schedule. Review each SKU by profit, turnover and share of sales. Shopify suggests flagging the bottom 10% to 20% of underperforming SKUs for retirement (Shopify, December 2025).
- Check before you cut. Ask whether the SKU is a duplicate or the only option of its kind.
- Retire cleanly. Sell the stock, archive the listing and remove the SKU from product feeds. Mark its images as retired, so nobody updates them again.
A tiering model for image budget
Rationalization gives every SKU a status. Use the same status to decide how many images the SKU gets.
| Tier | Which SKUs | Image set | Why |
|---|---|---|---|
| 1. Grow | Best sellers and planned launches | The full set, plus ad creative | These SKUs earn the traffic, so they earn the content |
| 2. Keep | Steady sellers | A core set for the listing | The listing must be complete. Ads are optional |
| 3. Watch | New or unproven SKUs, and slow ones under review | One accurate image of the real color | Enough to list and test. More comes if sales come |
| 4. Exit | SKUs marked for retirement | No new images | Any new image here is wasted |
Apply the tiers to the example of 200 color versions. The split is an assumption for the arithmetic:
- Tier 1: 30 versions × 5 images = 150
- Tier 2: 100 versions × 3 images = 300
- Tier 3: 50 versions × 1 image = 50
- Tier 4: 20 versions × 0 new images = 0
The total is 500 images, against 1,000 for the full set on every version. Every version on sale still has its own image.
The tiers have a cost. A tier 3 listing is thinner than a tier 1 listing. Move a SKU up a tier when its sales support it. For the shot list inside each tier, see our guide to planning a catalog photoshoot.
How SKU rationalization and image production inform each other
The merchandising team reviews SKUs, and the creative team produces images. Each job has information the other needs.

Rationalization informs production. Run the SKU review before the image run. The exit list tells the creative team what to skip. The grow list tells them where the full set goes.
Production informs rationalization. The creative team knows which SKUs have a complete listing and which have one old photo. Add that as a column in the SKU review. A slow SKU with a complete listing is a clear candidate to retire. For a slow SKU with one old photo, check the listing before you decide.
The content cost informs the gate. When someone proposes four new colors, the request should state the image count. In the example above, four colors on one product mean 20 new images at the full set.
A shared standard helps both. Our product photography style guide shows what to write down. For the cost of approving a large run, see bulk product images.
One workflow for the SKUs you keep
DesignerBox is AI creative production for brands and agencies. It makes images, ads and video, and a product photo is one of the inputs. Anyone can make an AI picture. Making hundreds that still look like your brand is the hard part.
You set your brand once, with its colors, fonts, rules and reference pictures. You build a workflow once. A batch then runs that workflow over a sheet, one row per product or color version, with up to 200 rows in a sheet. Row one and row two hundred read the same brand rules.
The tiers fit this shape. One workflow makes the full set and a second makes the core set. Each tier is its own sheet. The cost is shown before the run.
You keep or discard each result, and you re-run one row without changing the others. The same subscription covers the ads and the video for your tier 1 products: the full workflow from the first product photo to the finished ad, in one subscription. See the page for ecommerce brands.
The limits are worth stating. The SKU decisions and the color check against your physical sample stay with you. DesignerBox does not publish to a store. You download the results, or send them with a webhook or an S3 step. Every plan below Ultra is one seat. Uploading your own photos and the commercial license start on the Pro plan. AI video, virtual try-on, upscaling, the image editor and the video editor start on the Premium plan. Plans and credits are on the pricing page.
There is a free plan, and it runs on sample products. Get started free
FAQ
What is SKU proliferation?
SKU proliferation is the fast growth of a product catalog through new colors, sizes, bundles and line extensions. The term is used when the growth adds cost and complexity faster than it adds sales.
What is SKU rationalization?
SKU rationalization is a regular review of every SKU in the catalog. Each SKU is measured by profit, turnover and share of sales, then kept, changed or retired. Shopify suggests flagging the bottom 10% to 20% of underperforming SKUs, which is a starting point and not a fixed rule (Shopify, December 2025).
Does cutting SKUs reduce sales?
Not always. In one study of an online grocer, sales rose an average of 11% across 42 categories after a cut of mostly low-selling SKUs (Boatwright and Nunes, Journal of Marketing, 2001). The same study found that shoppers reacted in different ways when sizes were removed, so protect the options shoppers choose by.
How many images does a new SKU need?
A SKU that looks different from the others needs at least one image of its own. Google asks for a separate, dedicated image for every variant in a product listing (Google Merchant Center Help, read October 2026). A new size in an existing color usually needs no new image.
Can DesignerBox make the images for a growing catalog?
It can run the repeat part. A saved workflow applies your brand rules to each product, and a batch runs it over a sheet of up to 200 rows. You see the cost before you press Run, and you keep or discard each result. The SKU decisions and the color check stay with you.
Sources
- Definition of SKU proliferation, the six operational challenges, delayed differentiation and the 10% to 20% suggestion: Shopify, Reducing SKU Count: Managing SKU Proliferation, published December 2025, accessed October 2026
- Product variant limit of 2,048 per product: Shopify developer changelog, published October 2025, accessed October 2026
- Risks of line extensions that are not well managed: John Quelch and David Kenny, Extend Profits, Not Product Lines, Harvard Business Review, September 1994, accessed October 2026
- The best number of offerings and the cost of complexity: Mark Gottfredson and Keith Aspinall, Innovation Versus Complexity, Harvard Business Review, November 2005, accessed October 2026
- Product variety, fill rates and sales at 108 distribution centers: Wan, Evers and Dresner, Too much of a good thing, Journal of Operations Management, 2012, abstract accessed October 2026
- The online grocer SKU cut, the 11% average sales rise across 42 categories and the reactions by attribute: Boatwright and Nunes, Reducing Assortment: An Attribute-Based Approach, Journal of Marketing, July 2001, abstract accessed October 2026
- A dedicated image for every variant: Google Merchant Center Help, image link, accessed October 2026
- A new product requires a GTIN: GS1 GTIN Management Standard, new product introduction, accessed October 2026
- DesignerBox batch, brand and plan gates: DesignerBox batch page (designerbox.ai/product/batch), DesignerBox brand page (designerbox.ai/product/brand) and DesignerBox pricing page (designerbox.ai/pricing), October 2026
Shopify, Google and GS1 facts verified on each publisher’s own page, October 2026. Research findings are taken from each paper’s published abstract or summary, read October 2026. DesignerBox features verified on designerbox.ai, October 2026. The image counts and the tier split are illustrative arithmetic. Individual results vary.