
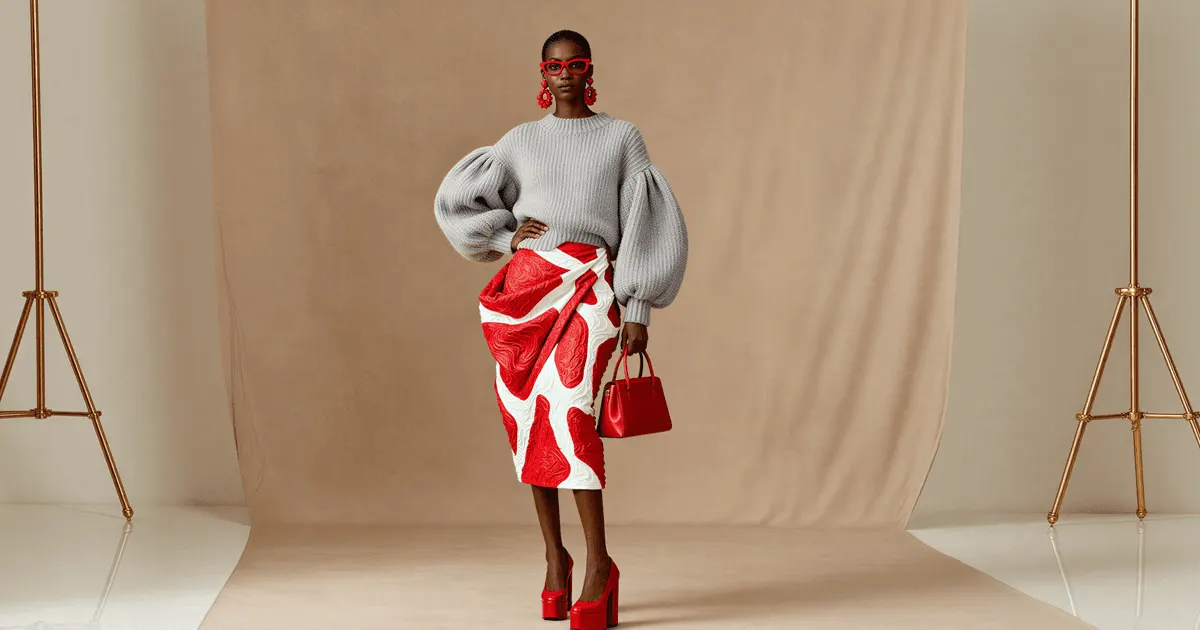
AI fashion photography at scale is priced by review more than by generation. Past a few hundred SKUs, what a catalog costs follows how many images a person sends back. The number to judge a tool on is first-pass acceptance rate: the share of generations that ship without a human touching them. On the worked assumptions below, a 40-point drop in that rate adds about $4,000 in review time on a 1,000-SKU catalog.
It is easy to shop this the other way. A buyer compares cents per image across three vendors and picks the cheapest. The real bill arrives later, as the hours someone on the ecommerce team spends looking at renders and sending half of them back.
This guide gives you the number to measure instead, a test that takes an afternoon, and the arithmetic that shows why a 20-point swing in acceptance costs more than any price difference between tools. It is written for a catalog run. A campaign of six looks has different math.
Key Takeaways
-
Review labor sets catalog cost more than generation does. On a 1,000-SKU catalog, dropping from 90% to 50% first-pass acceptance adds roughly $4,000 in review time against $1,300 in extra generation spend.
-
First-pass acceptance rate is testable in an afternoon. Run your 20 hardest SKUs, one reviewer, binary ship or no-ship, no fixing allowed. The percentage that ships is your floor.
-
Test your hardest products first. Sheer fabric, high shine, fine repeating print and complex drape are where acceptance collapses. A test on cotton tees tells you nothing. Intimates stack three of those in one garment, and where AI breaks on lace and mesh covers that failure set in detail.
-
Input consistency moves acceptance more than model choice. Standardized source photos lift first-pass rates further than switching between generators.
-
Some checks stay human permanently. Color truth and fit representation carry returns exposure. Apparel already returns at 20% to 40%, and fit drives about half of it.
What is AI fashion photography at scale?
AI fashion photography at scale means running a full catalog through generation rather than a sample set. The shift happens somewhere between 100 and 500 SKUs. Below that, a person can look at every image and fix what needs fixing. Above it, that person becomes the bottleneck, and the process needs an acceptance threshold, a review queue, and a rule for what gets sent back.
Producing fashion imagery at scale is the same job seen from operations. Every SKU, every colorway and every channel size comes out of one repeatable system. You make the creative decisions once a season, and the system applies them to each new product.
Campaign work sits at the other end of the same pipeline. An autumn lookbook trades volume for fabric fidelity on a few looks, and the lookbook shot list is set by who reads the book rather than by SKU count. Where a catalog is part shot and part generated, which slots to move to AI first decides the order.
How many files one garment becomes
One garment needs many files. Each sales channel asks for its own frame, and each colorway repeats the whole set. A 200-SKU drop in three colorways can need close to 5,000 files before any video. That count, more than the price of any single image, is why fashion imagery at scale needs a system.
| Channel | What it asks for |
|---|---|
| Amazon, main image | Pure white background, the product at 85% of the frame, adult clothing on a standing model |
| Amazon, other images | A main image plus at least six more images and one video |
| Google Merchant Center | A solid white or transparent background recommended for clothing and accessories, and a separate lifestyle image attribute for up to five images of the product in a real setting |
| Instagram feed ad | 4:5, at 1440 x 1800 pixels |
| Instagram Stories ad | 9:16, at 1440 x 2560 pixels |
The Amazon rows come from Amazon’s product image guide (Amazon Seller Central, accessed September 2026). The Google row comes from Google’s clothing and accessories guide and its lifestyle image attribute (clothing and accessories best practices and lifestyle image link, Google Merchant Center Help, accessed October 2026). The Instagram rows come from Meta’s ads guide for feed and Stories ads (Meta ads guide, accessed October 2026).
Work it through for one drop. Take 200 SKUs, three colorways each, and eight files per colorway: the Amazon main image, six more images and one social crop. That is 4,800 files. These counts are illustrative, so put in your own. Counting the images before a catalog photoshoot shows how three tiers cut a count like this.
Most of those 4,800 files repeat a setup that somebody already approved. The white-background frame on SKU 140 is the same job as on SKU 1. That makes them the right work for a saved workflow and the wrong work for a studio day.
Why per-image price is the wrong number to shop on
Per-image pricing is easy to compare, which is why vendors lead with it and why buyers anchor on it. It is also the smallest line in the budget once volume is real.
Work an example. A 1,000-SKU apparel catalog at three images per SKU needs 3,000 shipped images. Assume generation costs $0.50 per image and a reviewer costs $30 an hour fully loaded. Assume a pass takes about a minute to confirm and a reject takes about three, because a reject means deciding what went wrong, adjusting, and resubmitting.
| First-pass acceptance | Images generated | Review hours | Generation cost | Review cost | Total |
|---|---|---|---|---|---|
| 90% | 3,333 | 67 | $1,667 | $2,000 | $3,667 |
| 70% | 4,286 | 114 | $2,143 | $3,429 | $5,572 |
| 50% | 6,000 | 200 | $3,000 | $6,000 | $9,000 |
These figures are illustrative assumptions. Substitute your own reviewer rate and your own per-image price and the shape holds: moving from 90% to 50% acceptance adds about $1,333 in generation and about $4,000 in labor. The labor swing is three times the generation swing. The same arithmetic for one image, retry by retry, is in what a low first-pass rate costs per image.
Two consequences follow. A tool that costs twice as much per image and lands 20 points higher on acceptance is cheaper. And a vendor quote that does not come with an acceptance figure is quoting you the small half of the bill. The same denominator problem sits behind every headline saving, which is why your real cost per live SKU is worth calculating instead of accepting a percentage. Review minutes per approved image are also one of the three inputs that decide the return on AI fashion photography.
Acceptance rate is the throughput half of this. The output half is how much one physical sample produces before it goes back to the warehouse, which is a separate metric worth tracking alongside it and is covered in what actually pays in generative AI fashion production. High acceptance on a setup that still needs a fresh sample for every shot keeps most of the saving out of reach.
How to measure first-pass acceptance rate in an afternoon
You do not need a pilot, a data team, or a two-month evaluation. You need twenty products and one reviewer.
- Pick your twenty hardest SKUs. Sheer or semi-transparent fabric, high-shine satin and patent, fine repeating print, heavy texture, complex drape, and anything with a structural detail that has to stay put. Skip the plain cotton. You are measuring a floor.
- Generate your standard set for each. Whatever ships to a PDP today: front, back, detail. Same brief for all twenty, no per-product hand-tuning.
- Review once, binary. One person, one pass, ship or no-ship. No fixing, no “it would be fine if.” A maybe counts as a no.
- Divide. Shipped over generated. That is your first-pass acceptance rate on hard product.
- Log why each reject failed. Garment distortion, color shift, print break, pose, hands, background. The failure mix tells you whether the problem is fixable with better inputs or structural.
Run the same twenty through any tool you are evaluating. The comparison is now a number rather than an impression formed from a sample gallery, which every vendor picks from its best output. For a longer trial with a written pass line, see an AI proof of concept on about 100 of your own products.

Expect the catalog-wide figure to land above this floor, because most of your catalog is easier than your hardest twenty. That is the point. You are sizing the downside.
What to do with the number once you have it
The rate on its own is a score. The failure mix is the instruction.
Above roughly 85% on hard product: the setup is production-ready. Move straight to a saved workflow and spend your remaining effort on the source photo pipeline, because that is where the next constraint sits.
Between 60% and 85%: the setup is fixable, and the failure log tells you where. If rejects cluster on one or two garment types, route those to a separate pass rather than degrading the settings for the whole catalog. If they scatter evenly across products, the problem is upstream in the source photos.
Below 60% on hard product: stop tuning and re-test on your median SKU. If the median passes comfortably, you have a hard-product exception to handle separately, which is normal. If the median also struggles, the setup is wrong at the root and more prompt iteration will not recover it.
The split matters because these three states call for different work. Brands that treat every low rate as a prompting problem spend weeks iterating on something a standardized input shot would have fixed in a day.
What actually moves acceptance up
Input consistency is the biggest lever. Same distance, same lighting, same background, same garment presentation across every source photo. Brands that standardize the input shot see first-pass rates rise without changing anything downstream. Brands feeding in a mix of phone shots, old studio files and supplier images do not, whatever tool they use. What that standardized input frame has to carry is set out in what the source product photo needs. Consistency is half of it; the other half is picking a format that carries enough shape, and the input rule for fashion visuals sets out which garments need a form under them.
Locking the set comes second. Identity, lighting, framing and garment fidelity each drift independently between generations, and each needs pinning separately. The four locks and how to apply them are covered in holding a consistent on-model look drop to drop.
Saving the pass as a workflow comes third. A configuration that lives in someone’s head gets re-derived every drop and drifts every time. A saved workflow runs the same setup on each new SKU, one run per product. Batch runs one workflow over a whole sheet of products.
Picking the right frames to attempt is a lever before any of these. Acceptance rate collapses on shots that sit outside the published model limits in the first place, and the tiering in fashion photoshoot ideas, shoot it or generate it filters those out before they enter the queue.
What does not move acceptance: paying more per image for the same setup, and switching generator brands hoping the next one handles your satin. Model families differ, and which model fits which product shot is a real question, but it is a second-order lever against input quality. Rotating vendors while feeding the same inconsistent source photos reproduces the same rejects with different artifacts.
Where the bottleneck moves once acceptance is high
Fixing acceptance does not remove the constraint. It relocates it, usually twice.
First it moves to the source photo pipeline. When generation stops being the slow step, the question becomes how fast you can get a clean, standardized shot of every new SKU. For most brands that is a sample-room and logistics problem, and the launch calendar that problem sits on is where the weeks show up.
Then it moves to merchandising sign-off. Someone still has to agree the image represents the product. At 3,000 images a season that approval queue becomes the calendar, and it is the step brands most often forget to staff when they model the savings.
Last it moves to publishing. Approved files still have to reach live listings, and that stage runs at the API rate of the platform you sell on rather than at the speed of your tool. Where each stage of an automated run caps out puts numbers against it.
Parallel run caps matter here too. Throughput is bounded by how many jobs run at once, and on DesignerBox that number rises with the plan. A catalog run planned against a single-lane plan takes as long as the whole queue, so check the cap on the pricing page before you schedule a season.
Who owns each stage of the pipeline
At scale, people own the decisions and the checks. A saved workflow owns the repeats. The brief, the source photo, the color and fit check and the final sign-off stay with a person. The on-model set, the colorways and the channel crops go to the workflow, because each one repeats a setup a person already approved.
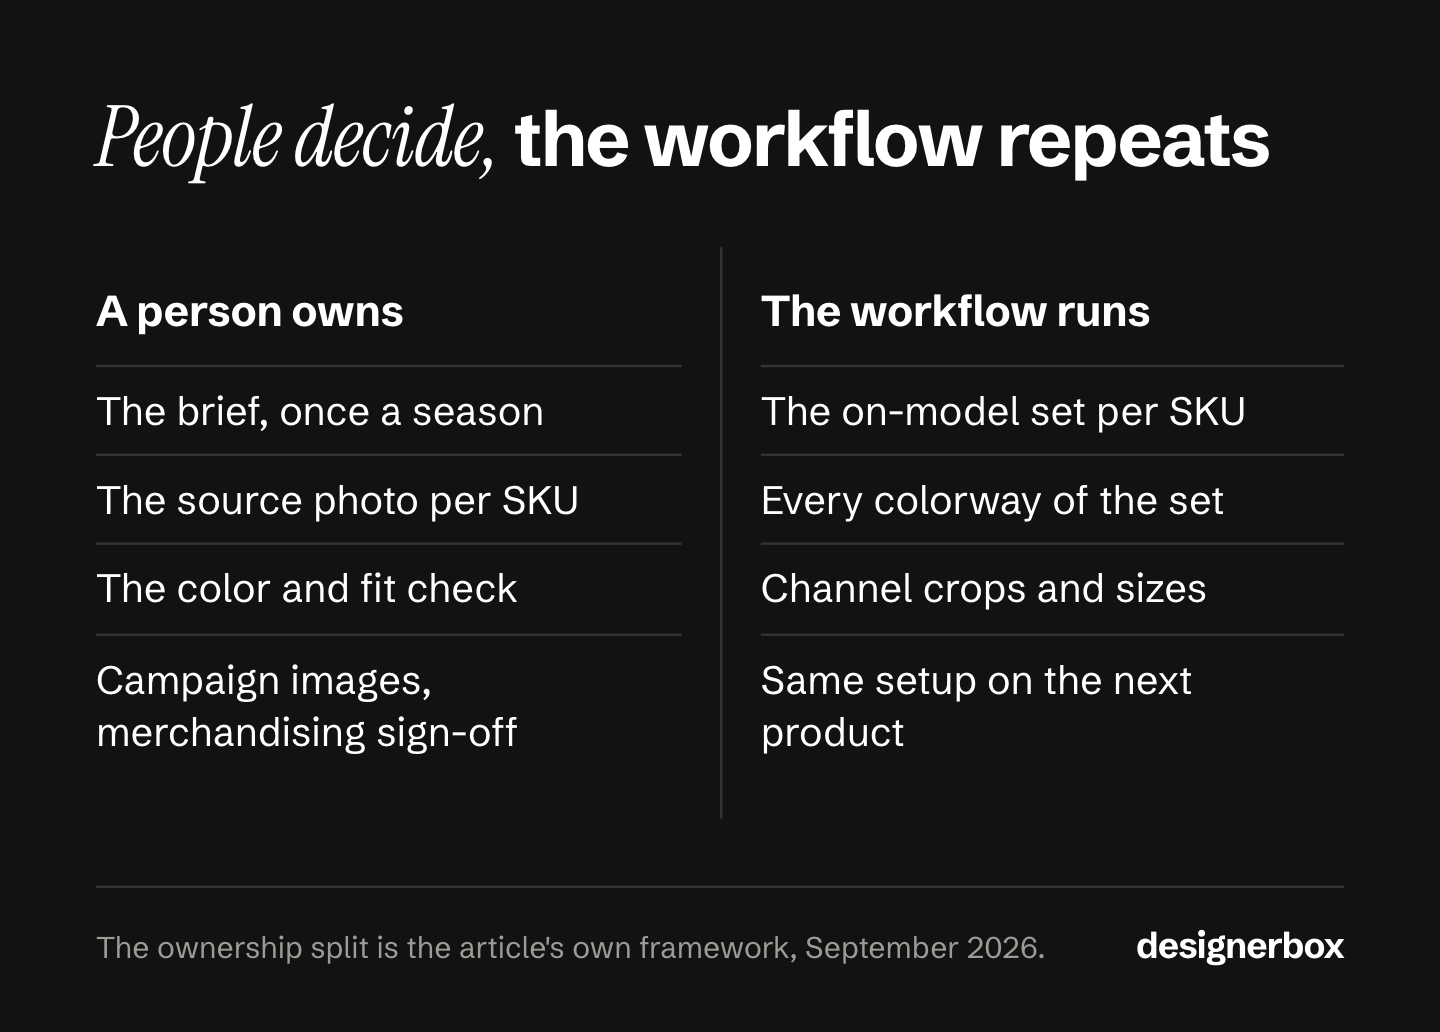
| Stage | Owner | Why |
|---|---|---|
| Brief: model, light, framing, backgrounds | A person, once a season | It is a taste decision, and every later file uses it |
| Source photo of each SKU | A person in the sample room | Input consistency moves acceptance more than anything after it |
| On-model set for each SKU | The workflow | Same setup, new garment |
| Colorways | The workflow, or an edit | The garment changes color, the shot stays the same |
| Channel crops and sizes | The workflow | Fixed specs, no judgment needed |
| Color and fit check | A person | It carries the returns risk |
| Campaign and hero images | A person leads, AI helps | One image carries the brand, so one person makes the call |
| Merchandising sign-off | A person | Someone has to agree the image shows the product |
The rule under the table is short. If a stage repeats an approved setup, the workflow runs it. If a stage needs a judgment about the brand or the product, a person keeps it. Give the brief to a model and every product inherits a guess. Keep the colorways in the studio and every drop waits for a booking.
What stays human, permanently
Two checks carry commercial exposure and should never move to an automated threshold.
Color truth. A shopper who receives a garment in a different shade than the PDP showed has a returns claim and a trust problem. Color shift is the failure mode most likely to pass a casual glance and fail a customer, which is why it sits inside the five accuracy checks worth running before you commit a model to your catalog.
Fit representation. This is where the money leaks. Compiled 2025 to 2026 ecommerce benchmarks put apparel return rates at 20% to 40% (richpanel.com, accessed August 2026). The National Retail Federation’s 2025 Retail Returns Landscape puts returns at 19.3% of online sales overall (accessed October 2026). The same compiled benchmarks put fit and sizing at about half of apparel returns. An on-model image that flatters the drape past what the garment does converts better and comes back more. The gain shows up in the ad account and the loss shows up in the returns line, usually reported by different people. Adding motion does not resolve that split either, which is why generated fashion video belongs on the creative line rather than the returns one.
If you are weighing shopper-facing try-on against brand-side generation, those carry different obligations and are covered separately in adding virtual try-on to your store.
Launching it one category at a time
Do not move the whole catalog at once. Pick one category, prove it on one drop, then add the next. The 20-SKU acceptance test tells you which category goes first. Your returns report tells you whether it worked.
- Rank your categories by difficulty. Opaque basics go first, knits and denim next, and sheer fabric, satin and fine print last. The reject log from your acceptance test gives you this order.
- Test inside the first category. Run its twenty hardest SKUs. Move the category only if it clears about 85%. Below that, fix the source photos first.
- Keep the hero shots on camera for the first drop. Move the PDP set, the colorways and the channel crops, because those repeat. The hero shot does not.
- Run one drop both ways. Keep the old process for the same SKUs and compare three numbers: cost per live SKU, days from sample to live listing, and the return rate for that category once the return window closes.
- Save the setup before you move on. The brief, the model, the light and the crops go into a saved workflow. The next category then starts from a known setup and not from blank.
- Test the next category again. A pass on cotton basics says nothing about satin, so each category gets its own test.
This order also gives finance a before-and-after on one category. That is easier to approve than a promise about the whole catalog.
A catalog run in DesignerBox
DesignerBox is AI creative production for brands and agencies. You fix the garment source, the model, the light and the framing on one SKU, and you save that as a workflow. A saved workflow runs the same way on the next product. You set the brand once, and the workflow reads it on every run. That is what keeps a 40-SKU drop to one standard when it arrives mid-week. Batch runs one workflow over a whole sheet of products, so the standard holds on row one and row two hundred. An on-model pose set template starts from your own garment photo, so the result shows your product and not a lookalike. The app that dresses a model in your garment lets a colleague repeat the job through a form. The fashion product photography page covers the drape, the fabric weight and the true dye color across cutouts, on-model views and detail crops.
A workflow can include three critic steps that score the results, and best-of-N keeps the best one. A person still makes the ship or no-ship call on color and fit.
Sequential edits change what a reject costs. The image editor makes one edit after another: relight the frame, change the angle, swap the background. The picture keeps its detail and resolution. A frame you can rescue with an edit does not go back through generation, so it does not re-enter the queue as a fresh run.
The model you pick and your shot count per SKU both change the cost of a run. You see that cost before you press Run. Credits reset monthly. Plans and credits are on the pricing page.
Three plan gates apply to a catalog run. Uploading your own photos and the commercial license start on the Pro plan. AI video, virtual try-on, upscaling, the image editor and the video editor start on the Premium plan. Team features, shared brand kits and white label are on the Ultra plan, and every plan below Ultra is one seat. That matters when more than one person reviews.
The source photo, the brand rules, the run, the edit, the video cut and the finished files all live in one workspace. The full workflow from the first product photo to the finished ad, in one subscription. If you are sizing this against a real catalog, AI product photography for ecommerce covers the per-SKU set and virtual try-on templates cover the worn shots.
To run the pass on your own hardest SKUs, start from a template, add your brand and your garments, and run it.
FAQ
What is a good first-pass acceptance rate for AI fashion photography?
We found no independent industry benchmark as of September 2026. Vendor-run figures exist, so check who ran the test before you compare. Measure your own floor on your twenty hardest SKUs and use it as the comparison point between tools. The gap between vendors on the same test set matters more than the absolute number.
How many SKUs before AI product photography needs a real process?
Somewhere between 100 and 500. Below that a single person can review everything and fix what fails. Above it you need an acceptance threshold, a rule for what gets resubmitted, and someone who owns the queue.
Which product category should move to AI first?
The category with the most SKUs and the plainest fabric, which is usually opaque basics. Run the 20-SKU acceptance test inside that category and move it only above about 85%. Keep hero shots on camera for the first drop. Sheer fabric, satin and fine prints move last.
Which garments fail AI generation most often?
Sheer and semi-transparent fabric, high-shine satin and patent, fine repeating prints that break across seams, heavy texture, and garments with structural detail that has to hold its shape. Plain opaque cotton passes almost everywhere, which is why testing on it is misleading.
Can AI fashion photos be used in paid ads and on marketplaces?
Commercial use terms depend on the tool. On DesignerBox the commercial license starts at the Pro plan. Marketplace rules are set separately by each platform, so check the listing policy for the channel you are publishing to. Our guide to AI fashion photography for ecommerce lists the rule per channel, from Amazon’s standing-model rule for adult clothing to Google’s AI metadata rule.
Do AI on-model images increase returns?
Only if they misrepresent fit or color. Apparel returns already run 20% to 40% with fit driving about half, so the risk exists with studio photography too. The control is a human check on color truth and fit representation before anything reaches a PDP.
What is the difference between the tools that do this?
They split mainly on how much control you get over the model and the set versus how much is pre-built for you. The trade-offs across the main options are laid out in AI fashion model generators compared.
Sources
- National Retail Federation, 2025 Retail Returns Landscape, October 2025, on the 19.3% online return rate, accessed October 2026
- Compiled 2025 to 2026 ecommerce returns benchmarks on the 20% to 40% apparel range and fit as roughly half of apparel returns, via richpanel.com, accessed August 2026
- Amazon Seller Central, product image guide (G1881), on the main image and image count, accessed September 2026
- Google Merchant Center Help, best practices for clothing and accessories, on the solid white or transparent background, accessed October 2026
- Google Merchant Center Help, lifestyle image link, on up to five lifestyle images, accessed October 2026
- Meta ads guide, Instagram feed image ads, on the 4:5 ratio at 1440 x 1800, and the Stories page of the same guide on 9:16 at 1440 x 2560, accessed October 2026
- DesignerBox plans, credit allocations, parallel runs and feature gating: DesignerBox pricing page (designerbox.ai/pricing), September 2026
The 19.3% online return rate was verified against the National Retail Federation’s 2025 report, and channel image specs against Amazon, Google and Meta, in September 2026. The Google rows were re-checked on 2 October 2026. The 20% to 40% apparel range comes from compiled benchmarks, not from the NRF report. The cost table uses stated assumptions, not measured benchmarks. Individual results vary.