
An AI workflow builder is a tool that chains generation and processing steps into one run you can save and repeat. You place nodes on a canvas, wire each node’s output into the next node’s input, set the parameters once, then point the whole graph at new inputs. The payoff is repeatability: build the job once, and row five hundred comes back to the same standard as row one.
Picture 200 products with four assets each. That is 800 generations, and nobody produces 800 of anything by hand. So you build a graph once and point it at a list. Then it fails on row 340, and you discover the retouch step was reading the wrong input for the entire run. Every hour you saved goes back into finding out which node lied to you.
This guide covers what a node canvas is made of, the vocabulary five well-known tools use for the same parts, how branching and looping behave, why a longer chain is a less reliable one, and the three build mistakes that turn a working graph into one nobody wants to open. It is written for creative and marketing teams evaluating a canvas, not for engineers shipping backend infrastructure.
Key Takeaways
- A canvas is a saved run, not a conversation. You wire the nodes once, then run the same graph against new products, new colourways, or a new folder of supplier photos.
- Every canvas is built from the same eight jobs. Input, trigger, generate, transform, branch, loop, review gate, export. The names change per tool, the jobs do not.
- Read the usage unit before the price. Tasks, executions and credits buy different amounts of work, and a cheap plan with an expensive unit costs more than a dear plan with a cheap one.
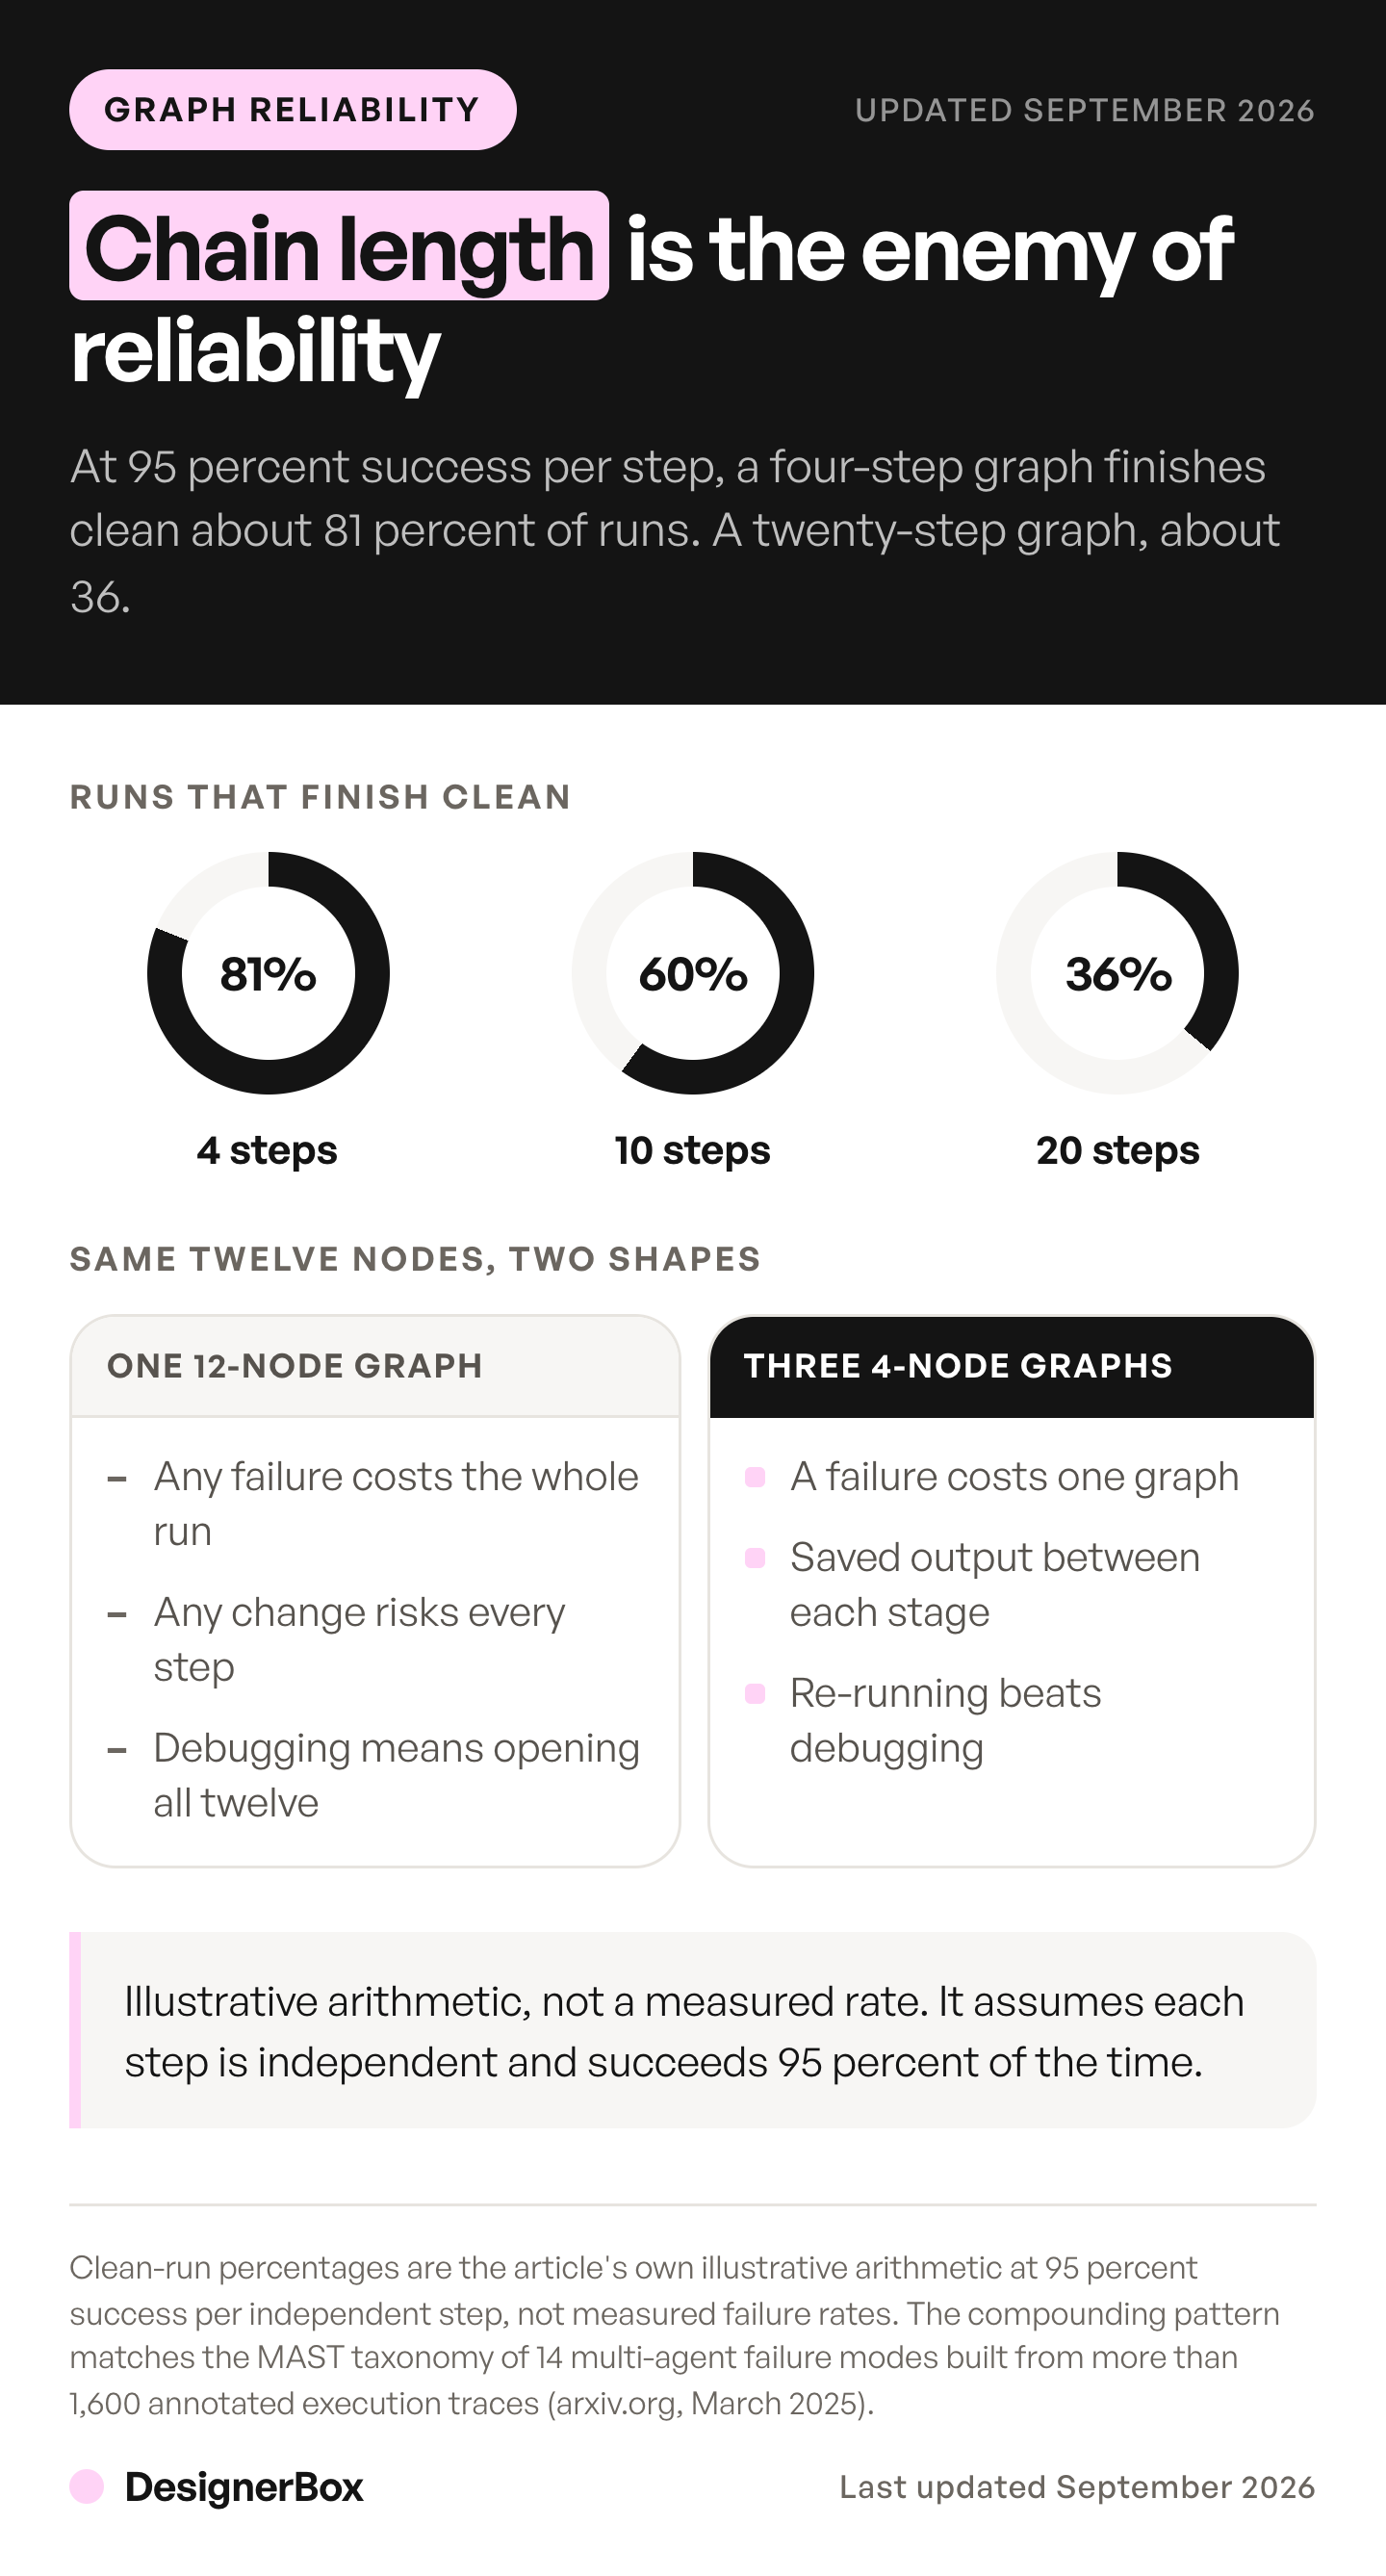
- Chain length is the enemy of reliability. At 95 percent success per step, a four-step graph finishes clean on about 81 percent of runs and a ten-step graph on about 60 percent.
- Three build mistakes cause most of the pain: one graph doing everything, parameters typed inside nodes, and no review gate in front of the expensive step.
- The model dropdown moves the bill more than the node count does. 800 images cost 3,200 credits on the cheapest model in DesignerBox and 11,200 on the default one. Read the run cost before the run.
- Video is a 14x range, not a wall. An 8-second clip runs 40 to 560 credits depending on the row you pick, so a loop with a video node needs a cap and a gate in front of it.
- A canvas is the wrong answer for a one-off. When a job runs once, a template or a one-field app gets you there faster.
What is an AI workflow builder?
An AI workflow builder is a visual editor where each step of a process is a box on a canvas and the wires between boxes carry data. You configure a step once, connect it to the next, and the whole graph runs as a unit. Some builders also write the graph for you from a plain-language description, then let you edit what they produced.
Two families sit under the same name and they solve different problems. The first is business automation: move a record from one system to another, call a model somewhere in the middle, write the result back. n8n, Zapier and Make grew up here. The second is creative production: take a product photo in, generate and edit assets from it, hand back a named set of files. ComfyUI and the node canvas on designerbox.ai sit here.
The shapes look identical on screen and the constraints are not. A business automation run is billed as a task or an execution. A creative run costs model time, measured in credits, and one bad branch can spend a month’s allocation in an afternoon. Read any canvas with that difference in mind before you compare anything else.
Which AI workflow builders are worth comparing in 2026?
A shortlist for this job usually mixes general automation platforms with creative canvases. Compare them on two things before you compare anything else: what the tool is built for, and what it counts when you run it. The unit is the part that decides your monthly bill, and it is the part most shortlists skip.
| Tool | Built for | What it counts | Where it fits |
|---|---|---|---|
| Make | Visual scenario automation across apps | Credits | Multi-app scenarios with a model call in the middle |
| Zapier | Broad app-to-app automation | Tasks | The widest connector coverage, one action at a time |
| BuildShip | Backend logic and agent tooling with code access | Credits | Teams who want a code step inside the graph |
| n8n | Self-hostable automation | Executions | One price per run whatever the node count |
| Gumloop | Marketing and operations automation | Credits | Marketing and operations sequences |
| ComfyUI | Node graphs for image and video generation | Your own compute, or cloud credits | Local control over the generation stack |
| DesignerBox | Catalogue-scale creative from your own products | Credits | One approved result rerun across a whole product list |
The unit column is where the surprises live. Zapier counts a task each time a Zap completes an action successfully, and does not charge you for checking for new data (zapier.com/pricing, September 2026). n8n prices “based on monthly workflow executions, regardless of complexity”, so one run of a twelve-node graph costs the same as one run of a three-node graph (n8n.io/pricing, September 2026). Make and Gumloop both count credits, and a credit buys a different amount of work in each. ComfyUI is the odd row here, because self-hosting swaps the subscription for a graphics card and your own setup time, and the hosted and local ComfyUI alternatives price that trade directly.
Creative canvases add a second variable the automation tools do not have. The same graph costs different amounts depending on which model each generate node is set to, which is covered further down.
What are the node types every canvas has?
Every visual workflow builder assembles the same eight jobs under different names. Those eight jobs group into the five stages an agentic creative workflow runs through: input, branch, generate, review gate, export. Learn the jobs first and any single tool’s vocabulary takes an afternoon. Learn one tool’s vocabulary first and you will keep hunting for a node that the next tool calls something else entirely.
| Job | What it does | What it needs from you |
|---|---|---|
| Input | Brings an asset, a row, or a folder into the run | A source location and a file naming rule |
| Trigger | Decides what starts the run | A schedule, a manual click, or an event |
| Generate | Calls a model and returns a new asset | A prompt, a reference, and a model choice |
| Transform | Changes an asset that already exists | The change, and the input it applies to |
| Branch | Sends the run down one path or another | A condition written as a rule, not a preference |
| Loop | Repeats a sub-chain over every item in a list | The list, and what one pass produces |
| Review gate | Stops the run for a person to approve | Who approves, and what happens on reject |
| Export | Writes the finished asset somewhere named | A destination and a naming convention |
The vocabulary maps like this. n8n calls the unit a node, defines a workflow as “a collection of nodes that automate a process”, and calls the thing that starts a run a trigger node, which is “a special node responsible for executing the workflow in response to certain conditions” (docs.n8n.io/glossary, September 2026).
Make calls the unit a module and the whole graph a scenario. Its branch is a router, which “allows you to branch the flow into several chains of modules”, and its loop is an iterator, “a special type of module that converts an array into a series of bundles” (help.make.com, September 2026).
Zapier calls the whole thing a Zap, with a trigger and one or more actions. Its branch is Paths, which the company describes as letting you “add multiple outcomes to one Zap”, and which it lists as available on Professional plans and higher (zapier.com/features/paths, September 2026). Billing follows the actions rather than the boxes: “When Zapier performs an action successfully, it counts as a task” (zapier.com/pricing, September 2026).
ComfyUI calls the unit a node too, describing nodes as “the fundamental building blocks for executing tasks”, each one “an independently built module” with its own function. The wire is a link, and links “carry data from one node’s output to another node’s input” (docs.comfy.org, September 2026). DesignerBox uses node on a canvas as well, and its workflows page describes building by dragging nodes, connecting outputs to inputs, configuring parameters, then running the pipeline, across 18 node types (designerbox.ai/workflows, September 2026).
How does branching work on a canvas?
A branch reads a value already in the run and sends the work down one path or another. It is a rule, not a judgement: match this string, exceed this number, contain this tag. Everything after the branch point runs only on the items that matched. Most tools also let you define a fallback path so nothing falls out of the run silently.

In creative production the useful branches are almost always about the input, not the output. Split on whether the source photo has a transparent background. Split on whether the product is apparel or hard goods, because one route needs a model and the other does not. Split on aspect ratio, because a square listing image and a 9:16 ad frame want different crops from the same generation.
The branch that causes trouble is the one that splits on quality. A rule like “if the output looks right” cannot be written as a condition, so people approximate it with a confidence score or a file size check and then trust the approximation. Put a person there instead. A saved reusable technique can hold the steps either side of that check, and a person makes the call in the middle, which is more honest than a rule pretending to judge an image.
One more thing worth knowing before you build: branches multiply. Three conditions with two outcomes each gives eight paths, and you now maintain eight. Keep the count low and put the variation in the parameters passed into a single path, rather than in the number of paths.
Where do loops belong in a graph?
A loop repeats one sub-chain over every item in a list. Feed it 200 product rows and it runs the same four nodes 200 times, once per row. This is where a canvas earns its price, because the alternative is opening the same tool 200 times and typing the same thing into it. The creative jobs a 200-SKU store can hand to an agent are all this shape: one sub-chain, run once per product.
Two rules keep a loop from becoming the most expensive mistake in the graph. First, test the sub-chain on one item before you point it at the list, and test it on the ugliest item you have rather than the nicest. Second, cap the first real run. Twenty rows tells you whether the naming holds and whether the crop is right. Eight hundred rows tells you the same thing and costs forty times more to find out.
Loops are also where credit spend stops being intuitive. Four credits for one image reads as nothing. The same job across a 200-SKU catalogue with four variants each is 800 operations, which is 3,200 credits on the cheapest image model and 11,200 on the default one. The bulk catalog processor workflow puts a real duration on the same shape of job: about 10 to 30 minutes for 100 SKUs, and 2 to 5 hours for 1,000 on the Premium tier.
Nest loops only when you have to. A loop inside a loop over 200 products and 4 colourways is 800 passes, and if the inner chain has five nodes you are asking 4,000 model calls to all behave. That is a different reliability problem, covered next.
Why does a longer chain fail more often?
Failure compounds multiplicatively across a chain. If each step succeeds 95 percent of the time and steps are independent, a four-step graph finishes clean on about 81 percent of runs, a ten-step graph on about 60 percent, and a twenty-step graph on about 36 percent. That is arithmetic, illustrative rather than measured, and it is the single most useful number to hold in your head while you build.
Research on multi-agent systems finds the same pattern for a different reason. The MAST taxonomy from Cemri and colleagues catalogues 14 distinct failure modes across three categories, system design issues, inter-agent misalignment, and task verification, built from a dataset of more than 1,600 annotated execution traces (arxiv.org, March 2025). Verification failure is its own category, which matches what teams see in practice: the chain does not stop, it keeps going with a bad intermediate result.
That is the difference between a broken graph and a silent one. A broken graph throws an error and you fix it. A silent graph produces 800 files where the background swap was applied to the wrong layer, and the only thing that catches it is a person opening the folder. Content-based checks matter more than status codes here, because a generation node returns a valid image whether or not that image is your product.
Design against length. Split a twelve-node monolith into three four-node graphs with a saved output between each, and a failure in graph two costs you graph two rather than the whole run. Fewer steps per run also makes the reject cheap, which is what lets you re-run instead of debugging. Teams already running agents that produce content hit the same wall and solve it the same way.
What three mistakes make a graph unmaintainable?
The three that cause the most rework are structural, and all three are cheap to avoid on day one and expensive to fix on day sixty. None of them are about picking the wrong tool.
One graph that does everything. Intake, generation, retouch, resize, naming and export in a single chain means any change risks the entire run, and any failure costs the whole run. Split at the natural handover points, usually wherever a person would look at the work anyway. Three graphs of four nodes beat one graph of twelve, even though the canvas looks emptier.
Parameters typed inside nodes. Hard-coding the brand colour, the aspect ratio or the product name into a node means a new colourway is a new graph, and six months later nobody knows which of the eleven near-identical graphs is current. Pass brand facts and product data in as inputs at the top. The graph then describes the process, and the run describes the product. This is also what keeps row five hundred looking like row one, because every row reads the same brand record instead of a prompt somebody retyped.
No review gate in front of the expensive step. Video and upscales are where the credits go, so that is where a person belongs. Approving after export means you paid for everything before you looked at anything. A gate in front of a 20-clip video node costs one person two minutes and can save 4,000 credits at five seconds a clip on the premium row. This is the same discipline that keeps a shared AI creative workflow predictable across a team.
A fourth habit is worth naming even though it is not a mistake exactly: nobody documents a canvas. Write one sentence per graph saying what goes in and what comes out, and put it in the graph’s name. The person who inherits it will not read a wiki, but they will read a name.
What does a creative workflow run cost in credits?
Creative canvases price by model time, so the run cost is set by what you generate and which model generates it, not by how many nodes you drew. In DesignerBox an image runs 3 to 22 credits a file depending on the model, an avatar set of nine fixed poses is 25, and video is priced per second of output. Plans are 112 credits free, 500 on Basic at $15 a month, 1,000 on Pro at $35, 2,500 on Premium at $75, and 8,000 on Ultra at $200, all billed monthly.
Work an example through. A 200-SKU catalogue with four assets each is 800 generations. On Seedream 5 at 4 credits a file that is 3,200 credits. On Nano Banana Pro, the default at 14, the same 800 files cost 11,200. One dropdown, 3.5x the bill. Add an edit pass over every asset on a 5-credit model and it is another 4,000. This is illustrative arithmetic rather than a quoted job price, since real catalogues mix hero shots with simple swaps.
Video is where the spread gets loud, and it is not the wall it is often described as. An 8-second clip runs 40 credits on the lite 720p row and 560 on Sora 2 Pro at 1080p, a 14x range on the same brief. Ten clips is 400 credits at one end and 5,600 at the other. Premium’s 2,500 a month buys seven premium 8-second clips or 62 lite ones, so the question is which row the node is set to rather than whether video fits at all.
That spread is the argument for reading a run cost before the run instead of a balance after it. A loop with a video node in it can swing by 14x on a setting nobody opened, and that is a graph design problem more than a budget one.
Two feature gates matter when you plan a build. AI video and try-on need Premium at $75 a month billed monthly or higher. Team collaboration, shared brand kits, white label and API access are Ultra at $200 a month billed monthly, and every tier below Ultra is a single seat. If three people need to open the same graph, that is the tier, and it belongs in the business case rather than in a surprise later. Compare that against the six-tool AI stack most teams are already paying for.
Do you need a canvas at all?
Probably not for the first job. A canvas pays for itself when the same shape of work repeats and the shape is stable. Build one for a monthly catalogue refresh, a seasonal reshoot, or an ad resize that runs every launch. Do not build one for something you will do once, because the build time is real and the graph will be stale before you run it again.

The useful framing is that a canvas is the engine, not the front door. The same workflow can be run three ways, and each way widens who can run it. Start from a template, and you begin at a finished result instead of a blank page. DesignerBox ships 273 image templates for exactly that. Edit one into your own version, with your brand and your products wired in, and it becomes a job that belongs to you. Put that same job behind a single form and a colleague runs it without ever opening the graph, which is what the 16 one-click apps are.
The honest test is how many times the job repeats in a quarter. Once is a one-click app. Twice is a template with the parameters written down. Three times or more, with the same inputs and the same outputs, is a graph worth building and saving.
There is a middle path that most teams skip. Run the job manually, but batch the work into scheduled runs so you at least stop context-switching between products. Keep notes on what you typed. When those notes stop changing between runs, you have found the graph, and now you know exactly what to wire.
The last consideration is who maintains it. A canvas with no owner degrades the same way a spreadsheet does. If nobody on the team can name the person who fixes the graph when a model changes, start from a saved workflow that already exists and edit it, rather than drawing one from blank. That is a legitimate answer, and it costs less than a graph nobody trusts.
FAQ
What is the difference between an AI workflow builder and a no code automation tool?
They overlap heavily. A no code automation tool moves data between apps and may call a model as one step. An AI workflow builder puts model calls at the centre, so generation, editing and review are first-class nodes rather than one action among many. Some tools do both. The practical difference is the usage unit: tasks and executions versus credits.
Do you need to know how to code to use a visual workflow builder?
No, for the common cases. Dragging nodes, wiring outputs to inputs and setting parameters requires no code in every tool named here. Code becomes useful at two edges: custom logic a built-in node does not cover, and calling an API the tool has no connector for. BuildShip and n8n both expose code steps for exactly those cases.
How many steps should one workflow have?
Fewer than you think. Four to six nodes per graph keeps failures cheap and diagnosis fast, since at 95 percent reliability per step a four-step chain finishes clean about 81 percent of the time. Chain several short graphs together with a saved output between them instead of building one long one. You keep the same result and lose the all-or-nothing run.
Can a visual workflow builder keep output on brand?
Only if the brand facts enter as inputs rather than living inside nodes. Pass colours, fonts, product references and the approved reference set into the graph at the top, and every downstream node reads the same source on every row. Add a review gate before export. DesignerBox holds brand facts in brand profiles, which its MCP server exposes alongside 68 tools.
What does an AI node editor cost to run?
Automation platforms bill by task or by execution, so the count is the node runs, not the output. Creative canvases bill by model time instead, which means the same graph costs different amounts depending on the model each node is set to. In DesignerBox an image runs 3 to 22 credits a file and video is priced per second of output, and Basic is $15 a month billed monthly for 500 credits.
When is a template better than building a workflow?
When the job runs once or twice, or when the shape is still changing. A template gets you a finished asset without a build step, and you can promote it to a graph later once the parameters stop moving. Build the graph on the third repeat with stable inputs and stable outputs, not on the first interesting idea.
Sources
- n8n per-execution pricing model, “based on monthly workflow executions, regardless of complexity”: n8n.io/pricing, September 2026
- n8n node, trigger node and workflow definitions: docs.n8n.io/glossary, September 2026
- Zapier task counting (“When Zapier performs an action successfully, it counts as a task”) and the note that checking for new data is not charged: zapier.com/pricing, September 2026
- Zapier Paths description and plan availability: zapier.com/features/paths, September 2026
- Make router and iterator definitions: help.make.com/router and help.make.com/iterator, September 2026
- ComfyUI node and link definitions: docs.comfy.org/development/core-concepts/nodes and /links, September 2026
- ComfyUI self-hosted install and Comfy Cloud: docs.comfy.org/get_started, September 2026
- Cemri et al., “Why Do Multi-Agent LLM Systems Fail?”, 14 failure modes over 1,600+ annotated traces: arXiv 2503.13657, March 2025
- DesignerBox canvas, node types and workflow steps: designerbox.ai/workflows, September 2026
- Bulk catalogue processing durations: designerbox.ai/batch, September 2026
- DesignerBox plans, credit rates per model, image template count and feature gating: live product configuration, September 2026
Node terminology and usage units verified from vendor product documentation as of September 2026. Individual results vary.