


An AI proof of concept is a short, bounded test that answers one question: does this tool work on our own material well enough to continue? For product images, you run about 100 of your own products through the tool. You judge every result against a pass line you wrote first. Then you count the cost per accepted image.
Most guides to an AI proof of concept are written for a company with a data team and a six-month plan. An agency with 10 people, or a brand with 200 products, has a smaller version of the same problem. The vendor’s demo looks good. Nobody knows if the tool keeps the label readable on product 140.
This guide covers that smaller test. It gives six steps, a sample size table, five numbers to count and a rule for the decision. It is written for agencies and brands that choose an AI product photography tool with their own money and no procurement team.
Key Takeaways
- A proof of concept answers one question. Can this tool make images we would accept, from our own products? A pilot answers a different one.
- The pass line comes first. Write what counts as a pass before you run anything, or the results will set the standard for you.
- 100 products is a workable sample. It gives a pass rate that is right to within about 10 points.
- Half the sample should be hard products. Glass, metal, small print and fine patterns are where image models fail.
- Count accepted images, not images. The cost per accepted image includes every failed attempt and every minute of review.
- Decide the three outcomes before the test. Go, change one thing and run again, or stop.
What is an AI proof of concept?
An AI proof of concept is a small test with a fixed end date and one question. It checks if an AI approach can do a specific job on your own data before you spend real money on it. It ends with a decision: continue, change the approach or stop. It is not a first version of the finished system.
Many of these tests end without a clear decision. Gartner predicted in July 2024 that “at least 30% of generative AI (GenAI) projects will be abandoned after proof of concept by the end of 2025”, and named poor data quality, weak risk controls, rising costs and unclear business value as the causes (Gartner, 29 July 2024). That was a forecast, not a count.
A survey gives a count. S&P Global Market Intelligence asked more than 1,000 respondents in North America and Europe. CIO Dive reported that “the average organization scrapped 46% of AI proof-of-concepts before they reached production” (CIO Dive, 14 March 2025). The survey covers AI projects of every kind, not image tools.
A scrapped test is not always a failure. A proof of concept that says “stop” in two weeks did its job. The expensive result is the test that ends with no answer, because nobody wrote down what a pass looks like.
Proof of concept vs pilot
A proof of concept asks if the tool can do the job. A pilot asks if your team can run the job with it, every week, at real volume. The first one tests the tool. The second one tests the tool inside your process. People often run a pilot and call it a proof of concept, then judge it on the wrong question.
| Proof of concept | Pilot | Rollout | |
|---|---|---|---|
| The question | Can it do the job on our products? | Can our team run it every week? | Is it the normal way we work? |
| Size | A sample, about 100 products | One real job, such as one product drop or one client | The whole catalog |
| Length | One to two weeks | One to two months | Ongoing |
| Who runs it | One person | The people who will use it | Everyone who needs images |
| What it ends with | Go, change or stop | A cost and a time per job | A routine |
The lengths are a working guide for image tools, not a standard. Keep the two stages apart. If the proof of concept passes, the pilot is the next step. If you skip to the pilot, you learn about your process and your tool at once, and you cannot tell which one failed.

Why is a vendor demo not proof?
A demo shows the vendor’s best results on the vendor’s products. A proof of concept shows typical results on yours. The gap between the two is the whole reason to test. No vendor publishes its failed images, and that is true of every tool in this market.
The US National Institute of Standards and Technology says the same thing in its AI Risk Management Framework. Its guidance tells teams to “measure AI systems prior to deployment in conditions similar to expected scenarios” and to “regularly test and evaluate systems in non-optimized conditions” (NIST AI RMF Playbook, accessed October 2026). A demo is the optimized condition.
One vendor has published a number for this gap. Photoroom reports a benchmark of 4,250 virtual-model generations across 850 products, in which the best of four editing models gave a clean image 29% of the time (photoroom.com, October 2026). The benchmark is vendor-run, and it covers on-model images only. Read it as a reason to test and not as a rate for your catalog.
How do you run an AI proof of concept for product images?
Run it in six steps, in this order. The order matters because steps 1 to 3 happen before you see a single result. Once you have seen results, you can no longer set a fair standard.
1. Write the question and the decision
Write one sentence: “Can this tool make listing images of our products that we would publish without a retouch?” Then write who decides, and on what date. A test with three questions gives three half answers.
2. Write the pass line
List the checks that every image must pass. Use yes or no checks that two people would answer the same way.
- Shape. The product has the same proportions and the same number of parts as the source photo.
- Color. The color matches the physical product, checked beside a sample.
- Text and logo. Every letter on the label is readable and correct.
- Nothing added, nothing missing. No extra button, strap, handle or cap.
- Channel rules. The image meets the rules of the place it goes.
Channel rules are public, so copy them in. Amazon asks for a main image with a pure white background and the product at 85% of the frame, and it turns on zoom from 1,000 pixels on the longest side (Amazon Seller Central, accessed October 2026). Google Merchant Center will require at least 500 x 500 pixels for all products from 31 January 2027. It also says AI images must keep the metadata that marks them as AI-generated (Google Merchant Center Help, accessed October 2026).
For the image checks in more detail, see the five checks in the guide to AI product photo accuracy. The product photography checklist lists 30 checks, from the source photo to the live listing.
3. Pick the sample
Take about 100 products. Make half of them ordinary and half of them hard. Hard products are the ones a photographer would also find slow: glass, polished metal, white on white, small printed text, fine patterns and sets with several pieces. If your sample is all easy products, you have built your own demo.
4. Run it the way you would run the real job
Use the plan you would buy, the person who would do the work and the source photos you already have. Do not let the vendor tune each prompt for you. Run each product once. Write down the start time and the end time.
5. Review every result
Look at each image beside its source photo. Mark it keep or discard. For each discard, write the reason from your pass line. Time the review. Ten minutes of notes here are worth more than any feature list.
6. Count five numbers
The next two sections cover the sample size and the five numbers.
How many products do you need to test?
About 100 for a first answer. A sample gives an estimate, and the size of the sample sets how far that estimate can be from the truth. With 100 products, a measured pass rate is right to within about 10 points, 19 times out of 20. With 30 products, the range is about 18 points each way.
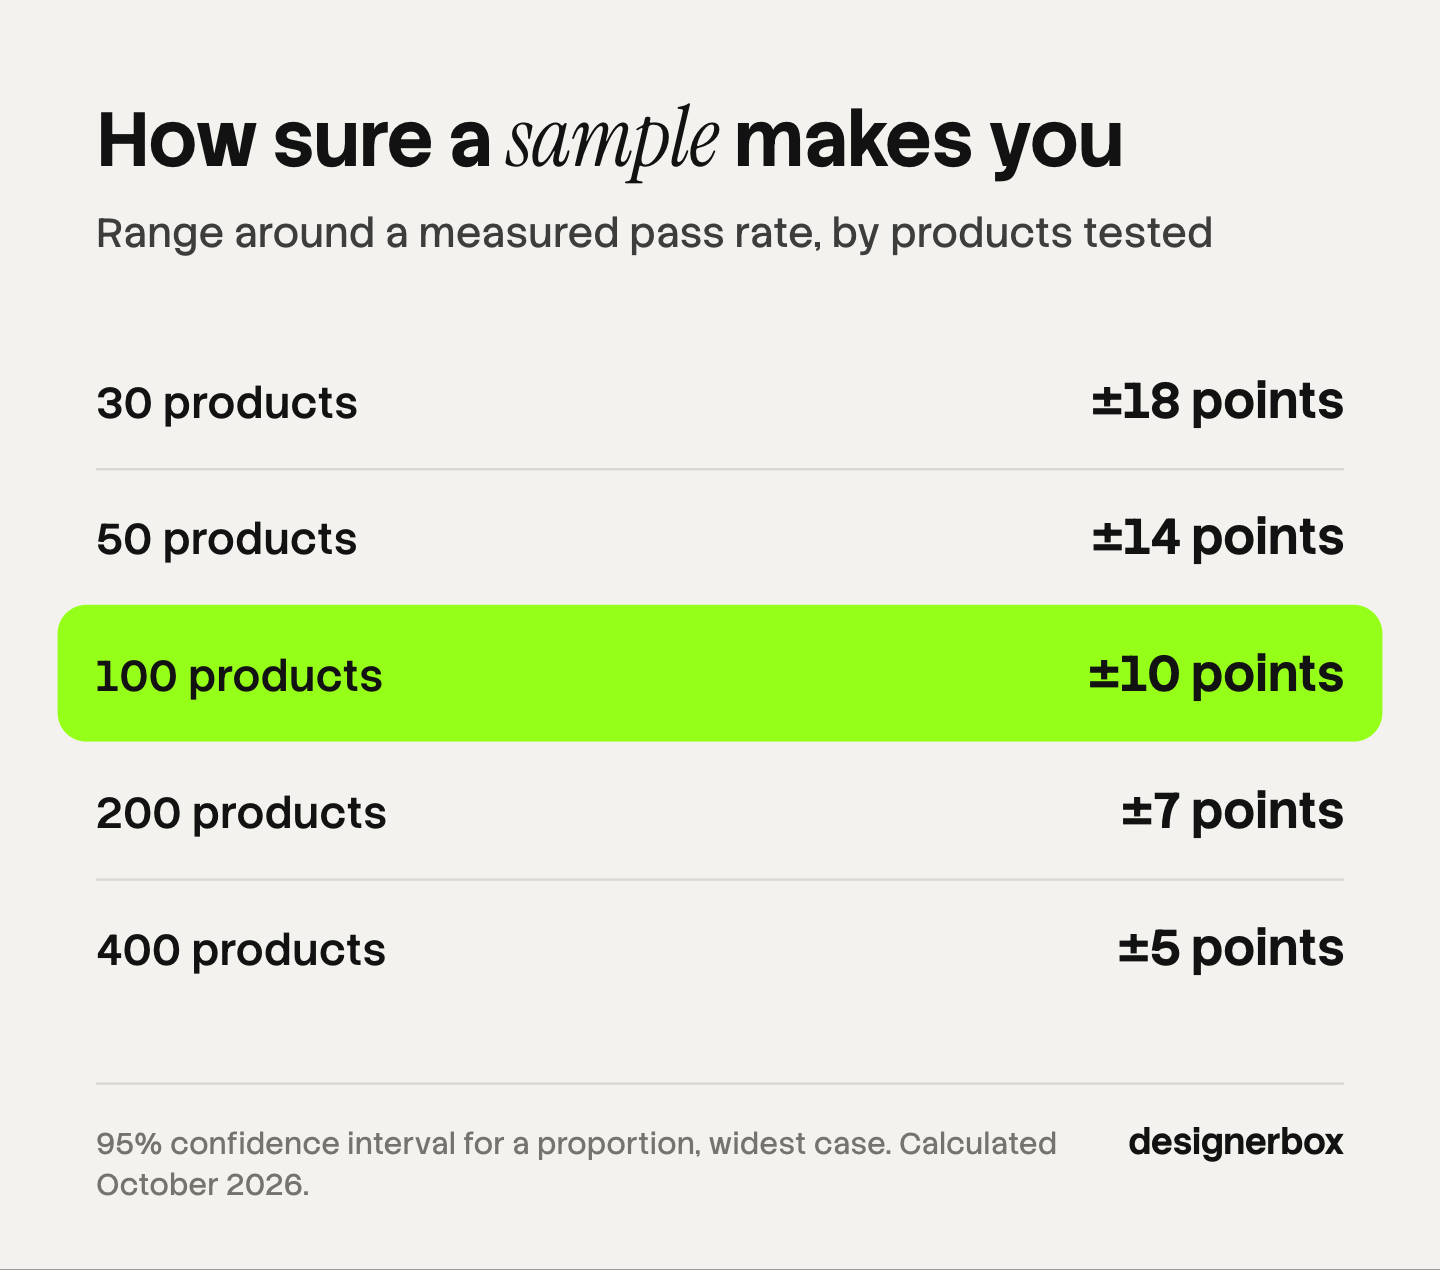
| Products tested | Range around the measured pass rate |
|---|---|
| 30 | About 18 points each way |
| 50 | About 14 points each way |
| 100 | About 10 points each way |
| 200 | About 7 points each way |
| 400 | About 5 points each way |
These figures use the standard 95% confidence interval for a proportion at its widest point, a pass rate of 50% (NIST Engineering Statistics Handbook, accessed October 2026). They are arithmetic, not a measured result.
The table explains why 10 good samples prove little. It also shows why 400 is rarely worth it for a first test. Going from 100 to 400 products takes four times the work and cuts the range by half.
A second rule helps with rare defects. If a defect never appears in a sample of n images, the true rate can still be as high as 3 divided by n. Statisticians call this the rule of three (Hanley and Lippman-Hand, JAMA, 1983). No wrong logos in 100 images means the real rate may be up to 3%. On a 2,000-image catalog, that could still be 60 images.
Which numbers decide the result?
Five numbers, all counted from your own test. None of them comes from the vendor’s website.
| Number | How to count it | What it tells you |
|---|---|---|
| Pass rate | Kept images divided by all images | How often one attempt is enough |
| Defects by type | Discards grouped by the reason | If the failures are one fixable problem or many |
| Review time per image | Total review minutes divided by images | The labor the tool adds |
| Cost per accepted image | Tool cost plus review cost, divided by kept images | The real unit price |
| Time for the run | End time minus start time | If the tool fits your deadline |
Cost per accepted image is the one most teams skip. Here is an illustrative example, not a measured result. Say a tool charges 20 cents an image. A reviewer needs 30 seconds an image and costs $30 an hour, so review adds 25 cents. Each attempt costs 45 cents.

At a 60% pass rate, 100 attempts cost $45 and give 60 accepted images, or 75 cents each. At a 90% pass rate, the same $45 gives 90 images at 50 cents each. A tool with a lower list price and a lower pass rate can cost more per accepted image.
Defects by type matter as much as the rate. If 30 of 40 discards share one cause, such as a color shift on dark fabrics, one change may fix most of them. If the 40 discards have 12 causes, a second run will not help.
Go, change or stop
Write the rule for each outcome before the test starts. The numbers below are an example. Set your own from what a retoucher or a studio costs you today.
- Go. The pass rate is at or above your line, such as 80%, and the cost per accepted image is below what you pay now. Move to a pilot on one real job.
- Change and run again. The pass rate is below the line, and most discards share one or two causes. Change one thing, such as the source photo or the brand rules, and run the same sample again.
- Stop. The pass rate is far below the line and the causes are spread out. Stop, keep your notes and test another tool with the same sample.
Use the same 100 products for every tool you test. A shared sample is what makes two tools comparable. For a list of tools to put through it, see the guide to the best AI product photography tools.
A proof of concept does not check everything. It says nothing about the contract, the license, data use or what you keep if you leave. Check those in parallel, with the questions in enterprise AI creative tools and in what you own in AI creative tools. If your team is thinking of writing its own system instead, the build vs buy AI guide lists the parts you would build.
The same test in DesignerBox
DesignerBox is AI creative production for brands and agencies. Anyone can make an AI picture. Making hundreds that still look like your brand is the hard part. A proof of concept measures that hard part, so the six steps map onto the product closely.
- The job, set up once. You build a workflow with your brand, your products and your rules. The workflow reads the brand profile on every run.
- The sample, in one sheet. Batch runs one workflow over a sheet of products. A sheet holds 200 rows, so a 100-product sample fits in one run.
- The review. Critic steps score the results, and best-of-N keeps the best one. You then keep or discard per row and re-run one row.
- The cost. The cost is shown before the run, so you know the tool cost of the sample before you start it.
The full workflow from the first product photo to the finished ad, in one subscription. A test that starts with listing images can continue to ad sizes and video with the same brand rules.
The limits belong in your test notes. There is a free plan, and it runs on sample products. Uploading your own photos and the commercial license start on the Pro plan, so a test on your own catalog needs Pro. Plans and credits are on the pricing page. DesignerBox does not publish results to a store. You download the results, or send them with a webhook or an S3 step. Every plan below Ultra is one seat. Other tools also show a cost before a run, so compare tools on your own sample and not on a feature list. DesignerBox has published no pass rate of its own, and your test is the only number that counts for your catalog.
A free plan for your first run
There is a free plan. Start from a template and see the cost before you run it. Get started free
FAQ
What is an AI proof of concept?
It is a short test with one question and a fixed end date. It checks if an AI tool can do a specific job on your own data before you commit money to it. It ends with a decision to continue, change the approach or stop.
What is the difference between a proof of concept and a pilot?
A proof of concept tests the tool on a sample. A pilot tests the tool inside your real process, with the people who will use it, on one real job. Run the proof of concept first, so that a failed pilot tells you about your process and not about the tool.
How many images do you need for an AI proof of concept?
About 100 products is a workable sample. It gives a pass rate that is right to within about 10 points. With 30 products the range is about 18 points each way, which is too wide to compare two tools.
What are good success criteria for an AI proof of concept?
Good criteria are written before the test and can be answered with yes or no. For product images, use a pass rate, a cost per accepted image and a review time per image. Set each line from what you pay a studio or a retoucher today.
How long should an AI proof of concept take?
For an image tool, one to two weeks is enough. The run itself often takes hours. Most of the time goes into choosing the sample, writing the pass line and reviewing each result beside its source photo.
Why do AI proofs of concept fail?
Gartner names poor data quality, weak risk controls, rising costs and unclear business value. In practice, many tests end with no decision because nobody wrote the pass line first. A test that ends with a clear “stop” has worked.
Can you run a proof of concept on the DesignerBox free plan?
Only on sample products. The free plan shows how a workflow runs. A test on your own catalog needs your own photos, and uploading them starts on the Pro plan.
Sources
- Gartner: 30% of generative AI projects will be abandoned after proof of concept by end of 2025, press release, 29 July 2024
- CIO Dive: AI project failure rates are on the rise, reporting S&P Global Market Intelligence survey data, 14 March 2025
- NIST AI Risk Management Framework Playbook, Measure 2.3, accessed October 2026
- NIST/SEMATECH e-Handbook of Statistical Methods, confidence intervals for a proportion, accessed October 2026
- Hanley and Lippman-Hand, “If Nothing Goes Wrong, Is Everything All Right?”, JAMA 249(13), 1983
- Amazon Seller Central: product image requirements, accessed October 2026
- Google Merchant Center Help: image link, accessed October 2026
- Photoroom benchmark of 4,250 virtual-model generations, vendor-run (photoroom.com, October 2026)
- DesignerBox workflows, batch and pricing pages (designerbox.ai), October 2026
Survey figures, platform rules and vendor statements verified from the sources above as of October 2026. Individual results vary.