


To improve ROAS with product video, change one of the four numbers that make it up: the cost of 1,000 impressions, the click rate, the conversion rate or the order value. A video helps when it raises a rate or lowers that cost. Cheaper production does not change ROAS at all, because ROAS divides revenue by ad spend. Production cost changes profit.
Most advice on this topic says that AI video lifts return on ad spend because you can make more of it for less. That mixes two things. Making more versions gives you more chances to find a strong ad. Making them for less protects your margin. Only the first one shows in the ROAS column.
This guide splits ROAS into its parts, shows which part a product video can move, and lists the limits of the published evidence. The reader in mind is a performance marketer at a brand or an agency who ships video ads every week.
Key Takeaways
- ROAS is revenue divided by ad spend. Production cost is not in the formula, so a cheaper video cannot raise it.
- Four numbers make ROAS. Click rate, conversion rate and order value multiply. The cost of 1,000 impressions divides.
- Break-even ROAS comes first. It is 1 divided by your margin before ads. A 40% margin needs a ROAS of 2.5.
- The strongest evidence is on conversion. Google and Amazon both publish lift figures for adding video, and both measure conversions or sales, not ROAS.
- Platform ROAS is attributed, not caused. Meta itself calls incrementality tests “the gold standard in measurement”.
- Test one video change at a time. A new first second, a new proof shot or a new offer, against the same control.
- Count production in profit. A video can beat break-even ROAS and still lose money once you add what it cost to make.
What is ROAS, and what does it leave out?
ROAS is return on ad spend: the revenue credited to your ads, divided by what you paid the platform for them. Meta defines purchase ROAS as “the total return on ad spend (ROAS) from purchases”, based on information from your connected Meta Business Tools “and attributed to your ads” (facebook.com/business/help, October 2026).

Google uses the same division and writes it as a percentage. Its example for a target ROAS is “$5 USD in sales ÷ $1 USD in ad spend x 100% = 500% target ROAS” (support.google.com, October 2026). A ROAS of 5 and a ROAS of 500% are the same result.
Three things are missing from that number:
- The cost of the product. ROAS counts revenue, so it ignores cost of goods, shipping and returns.
- The cost of the creative. The shoot, the editor and the tool subscription are not ad spend.
- Whether the ad caused the sale. “Attributed” means the platform linked a purchase to an ad. It does not mean the purchase needed the ad.
Each gap has its own fix later in this guide: break-even ROAS, a profit line for creative, and a holdout test.
What is break-even ROAS?
Break-even ROAS is the ROAS at which ad spend uses all of your margin. The formula is 1 divided by your margin before ad spend, written as a decimal. With a 40% margin, break-even ROAS is 1 ÷ 0.40 = 2.5. Below 2.5 each order loses money. Above it each order pays for more than its own ad.
| Margin before ads | Break-even ROAS |
|---|---|
| 20% | 5.0 |
| 30% | 3.33 |
| 40% | 2.5 |
| 50% | 2.0 |
| 60% | 1.67 |
That table is arithmetic. It is not a benchmark. It also answers the common question about what a good ROAS is. A good ROAS is one above your own break-even, by enough to pay for the work behind the ads. A store with a 60% margin can grow at a ROAS that would close a store with a 20% margin.
Work out this number before you judge any video. A product video that moves ROAS from 2.0 to 2.3 looks like a 15% win. At a 40% margin it still loses money on every order.
Which four numbers decide ROAS?
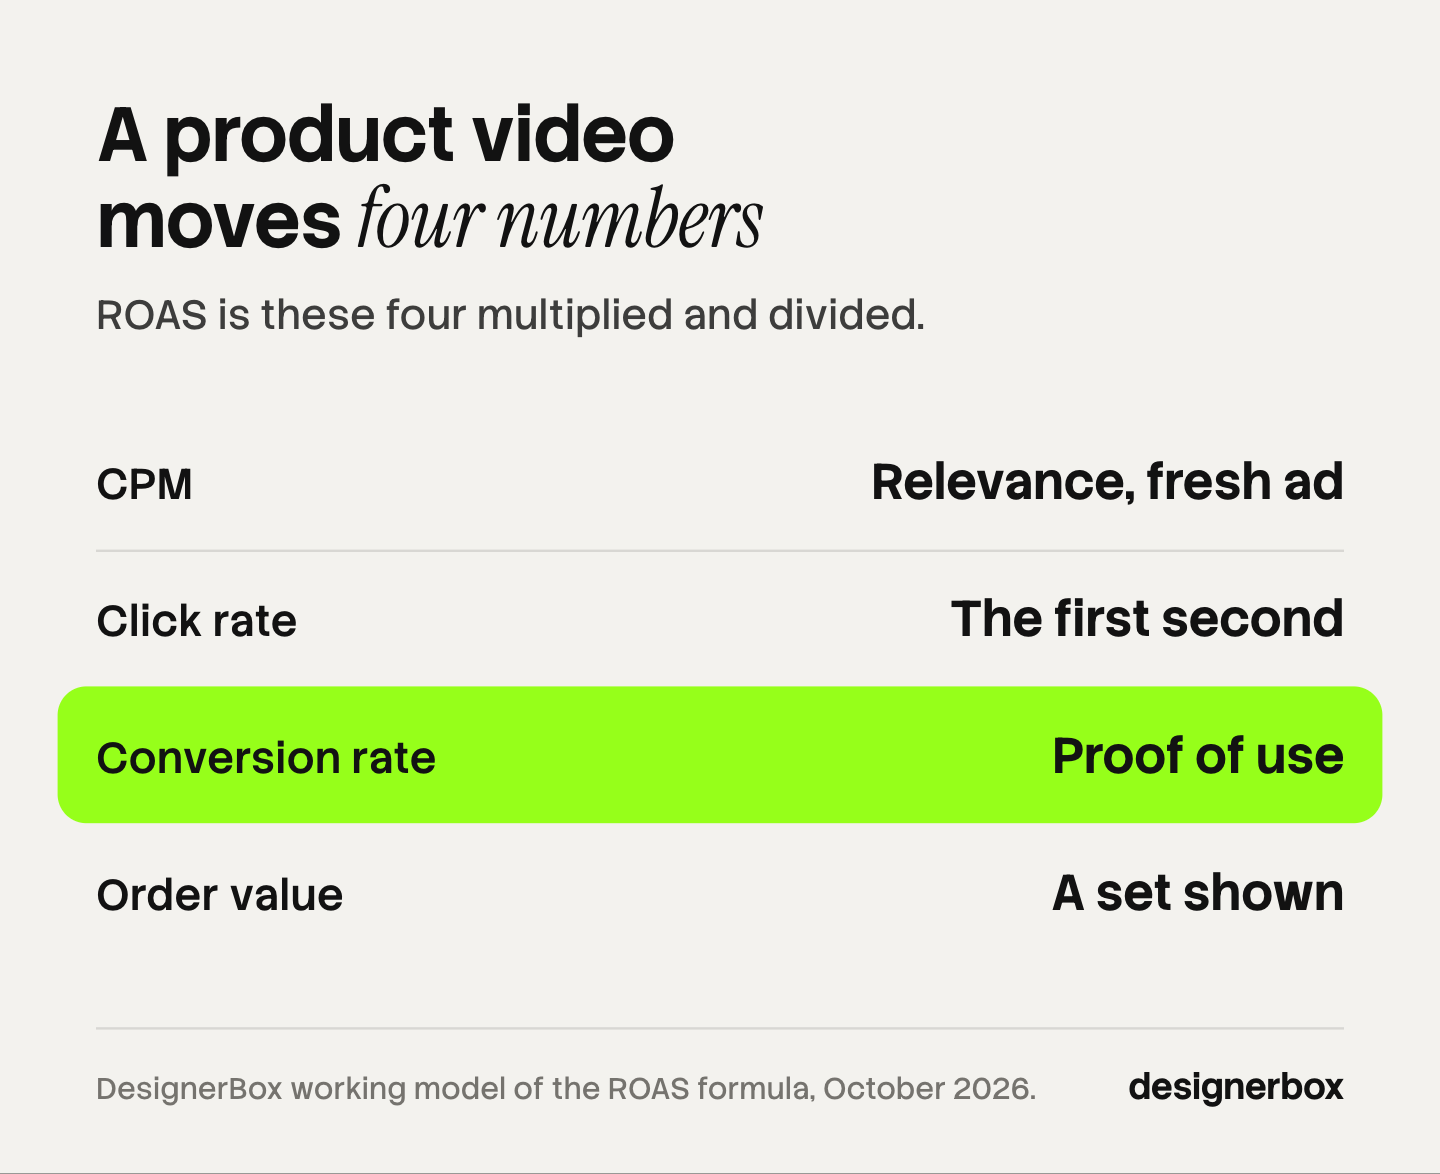
Four numbers decide ROAS: the cost of 1,000 impressions (CPM), the click rate, the conversion rate and the average order value. Multiply the click rate, the conversion rate and the order value by 1,000, then divide by the CPM. The result is the same ROAS your ads manager shows. Any change to a video ad has to act on one of the four.
A worked example, illustrative only. Take a CPM of $10, a click rate of 1.5%, a conversion rate of 3% and an average order of $70.
- 1,000 impressions cost $10 and bring 15 clicks.
- 15 clicks at 3% bring 0.45 orders.
- 0.45 orders at $70 bring $31.50 of revenue.
- ROAS is 31.50 ÷ 10 = 3.15.
Now change one number. A new opening lifts the click rate from 1.5% to 1.8%, and nothing else moves. The same 1,000 impressions bring 18 clicks, 0.54 orders and $37.80. ROAS is 3.78. A 20% lift in one rate gave a 20% lift in ROAS, because the numbers multiply.
That is the useful way to read a video ad. Ask which of the four numbers it is built to move, and check that number first.
| Number | What in a product video moves it | Where to read it |
|---|---|---|
| CPM | Relevance to the viewer, and a fresh ad | Ads manager |
| Click rate | The first second, and the offer | Ads manager |
| Conversion rate | Proof that answers the buyer’s doubt | Store analytics |
| Order value | A bundle or a set shown in use | Store analytics |
How does product video move each number?
A product video moves the click rate with its opening and its offer. It moves the conversion rate when it shows the product in use and answers a doubt. It moves order value when it shows a set or a bundle. It moves CPM through the auction, where a more relevant ad can win a place at a lower bid.
CPM
Meta’s auction ranks ads by total value, which combines three things: the bid, the estimated action rates and the ad quality. Meta states the result plainly: “an ad that’s more relevant to a person could win an auction against ads with higher bids” (facebook.com/business/help, October 2026). A video that more people act on costs less to deliver.
The same page carries a warning: “Engaging in clickbait and engagement bait does not improve ad performance.” A shocking first frame is not a route to a lower CPM.
Age matters too. Meta marks an ad as “Creative limited” when its cost per result is higher than your past ads, and as “Creative fatigue” when that cost is at least twice as high (facebook.com/business/help, October 2026). A new video resets what the viewer has seen. The signs and the refresh rules are in the guide to ad fatigue.
Click rate
The click rate depends on the first second and on the reason to leave the feed. Meta reported in March 2026 that “46% of online purchase conversions with Reels now happen within the first 2 seconds of attention on our video ads” (facebook.com/business/news, March 2026). Put the product and the claim on screen at once.
Two custom metrics show where a video loses people before the click. Both are explained in the guide to hook rate and hold rate.
Conversion rate
This is where video has its best published support. A still shows what a product looks like. A video can show its size in a hand, how it opens, how the fabric moves and what the result looks like. Those are the doubts that stop an order.
The beat-by-beat structures for this are in ecommerce product video frameworks. One rule from that guide matters most here: each video answers one doubt.
Order value
A video can show three products used together in ten seconds. A single image rarely can. If your margin is thin, a video that sells the set can clear break-even where a video for one item cannot. Check order value by ad in your store analytics, because the ads manager reports revenue and not basket size.
What does the evidence say about video and ROAS?
The published evidence supports video on conversions and sales. No platform publishes a ROAS lift for video. Google reports more conversions when a campaign includes a video. Amazon reports more sales on product pages with one. A large study of packaged goods campaigns credits creative with about half of the sales that advertising adds. None of these is a promise for your account.
| Source | What it measured | Result | Limit |
|---|---|---|---|
| Google Ads Help | Performance Max campaigns with at least one video | ”an average increase of 12% total additional conversions” | Google internal data, global, November 2022. Conversions, not ROAS |
| Google Ads Help | Campaigns with horizontal, vertical and square video | ”20% more conversions in YouTube compared to horizontal videos alone” | Same data set |
| Amazon seller guide | Product pages with a first shoppable video | ”an average 24% increase in sales” | A product page, not an ad. Amazon’s own data |
| NCSolutions, 2023 | Nearly 450 packaged goods campaigns on digital and TV | Creative drives 49% of incremental sales | Packaged goods. All creative, not video alone |
The Google figures come from its Performance Max guidance (support.google.com, October 2026). The Amazon figure comes from its seller guide to product videos (sell.amazon.com, October 2026). The NCSolutions figure comes from its Five Keys to Advertising Effectiveness report, which found the share unchanged from its 2017 study (ncsolutions.com, August 2023).
Read the limits column as carefully as the result column. More conversions at a higher cost can leave ROAS flat. A lift on a product page says nothing about an ad in a feed. The sources behind the famous video statistics are traced in video conversion rate.
For AI video, the honest position is narrower still. A generated video is one more version to test. Whether it wins depends on the same four numbers, and the product in it has to match the product you ship. The costs are in what one AI video ad costs.
Why can platform ROAS mislead you?
Platform ROAS can mislead you because it reports sales linked to an ad, not sales caused by it. Some of those buyers would have bought without the ad. A video shown mostly to past visitors can post a high ROAS and add little. Only a test with a holdout group, where some people never see the ad, measures the difference.
Meta says this itself. Its March 2026 measurement post tells advertisers to ask “What outcomes did this ad or campaign cause that would not have happened otherwise?” and calls incrementality experiments such as Conversion Lift “the gold standard in measurement” (facebook.com/business/news, March 2026).
The research agrees. A study of 15 US advertising experiments at Facebook covered 500 million user observations and 1.6 billion ad impressions. It found that observational methods “often fail to produce the same effects as the randomized experiments”, even with detailed data on each person (Gordon, Zettelmeyer, Bhargava and Chapsky, published in Marketing Science in 2019).
The rules of attribution also move. In that same post Meta changed click-through attribution “to exclusively include link clicks”, and cut the engaged view for a video ad “from 10 seconds to 5 seconds”. Both changes alter which sales a video is credited with. A ROAS from February 2026 and a ROAS from October 2026 are not counted the same way. Compare a video with other ads from the same weeks, never with last year’s number.
How do you test whether a video improved ROAS?
Test a video against a control that differs in one thing. Keep the product, the offer, the audience and the landing page the same, and change one part of the video. Run both for the same days. Then read the four numbers before you read ROAS, so you know which number moved and why.
- Write down break-even ROAS. Use the margin for the product in the ad, not the store average.
- Pick the number to move. A new first second aims at click rate. A new proof shot aims at conversion rate. A bundle aims at order value.
- Change one part. Keep the rest of the cut. Two changes at once give a result you cannot read.
- Run it as a real test. Use the platform’s split test so the two ads do not compete for one budget. The setup and the sample sizes are in ad creative testing.
- Read the result in order. CPM, click rate, conversion rate, order value, then ROAS. Where you can, confirm a winner with a holdout test.
Small numbers mislead here. An ad with 12 purchases can show a ROAS of 6 on Monday and 2 on Friday. Wait for enough orders on each side before you call a winner.

Where does production cost belong?
Production cost belongs in profit, on its own line. It never enters ROAS. Add up what the video cost to make, then compare that with the margin its ad spend earned. A video can clear break-even ROAS and still lose money once the shoot is counted. A cheaper way to make each version lowers that risk and leaves ROAS the same.
An illustrative case. A video ad spends $10,000 at a ROAS of 3.15. Revenue is $31,500. At a 40% margin that is $12,600, and $2,600 remains after the ad spend. If the video cost $3,000 to produce, the campaign lost $400 while the ROAS column showed a number well above break-even.
This is the real case for making video with AI. It does not raise ROAS by being cheap. It lets you afford the five versions that a test needs, so one of them can raise a rate. It also means a losing version costs less to learn from. The count of versions each spend level needs is covered in creative strategy.
Video versions that keep the brand
Anyone can make an AI picture. Making hundreds that still look like your brand is the hard part. A ROAS test asks for five versions of one video, and each version still has to show the real product, in your colors, with your claim.
DesignerBox is AI creative production for brands and agencies. You build the job once as a workflow with your brand rules and your product photos, then run it on every new product. AI video ads turn a product photo or a winning static ad into a short vertical video. The video editor is a real timeline, with several tracks, transitions, animated text and audio, so you can replace the first second of a cut and keep the rest.
Three critic steps score the results of a run, and best-of-N keeps the best one. You still watch every version before it ships. The cost is shown before the run, which gives you the production line for the profit sum above. For teams that run paid social every week, the page for performance marketers shows the full job.
The full workflow from the first product photo to the finished ad, in one subscription.
Here are the limits. DesignerBox does not read your ad account, so ROAS stays in your ads manager and your store analytics. It does not publish ads for you: you download the results, or send them with a webhook or an S3 step. It cannot promise a ROAS, and no tool can. Video starts on the Premium plan, and an 8-second clip costs 40 to 560 credits, depending on the model. Uploading your own photos and the commercial license start on the Pro plan. Team features are on the Ultra plan, and every plan below Ultra is one seat. The free plan cannot make video.
A free plan for your first run
Start from a template, add your brand and your products, and see the cost before you run it. Get started free.
FAQ
How do you improve ROAS with video ads?
Change the part of the video that controls one of four numbers. A stronger first second raises click rate. A proof shot that answers a buyer’s doubt raises conversion rate. A bundle shown in use raises order value. A more relevant, newer ad can lower CPM. Test one change at a time against the same control.
What is break-even ROAS?
Break-even ROAS is the point where ad spend uses all of your margin. Divide 1 by your margin before ads. A 40% margin gives 2.5, and a 25% margin gives 4. Any ROAS above that number earns money on each order, before you count what the creative cost to make.
Do AI product videos improve ROAS?
They can, but not by being cheaper. ROAS is revenue divided by ad spend, and production cost is in neither. AI video helps when it lets you test more versions and one of them raises click rate or conversion rate. The lower production cost shows in profit, on a separate line.
Are video ads better than image ads for ROAS?
No platform publishes a rule. Google reports an average of 12% more conversions for Performance Max campaigns that include a video, on its own 2022 data. That is conversions, not ROAS. Many accounts run both formats. Test a video against your best static ad with the same product and offer.
Why does my ROAS look different in Meta and Google Analytics?
Each tool credits sales by its own rules. In March 2026 Meta changed click-through attribution to count link clicks only, to align better with tools such as Google Analytics. Views and engagement are still credited in other attribution settings. Compare ads inside one tool, over the same dates.
What is a good ROAS for ecommerce?
A good ROAS is one above your own break-even. That depends on your margin, so a single benchmark does not fit every store. Work out 1 divided by your margin before ads, then add room for creative and staff costs. Judge each video against that number.
Sources
- Meta Business Help Center, Purchases ROAS (return on ad spend): facebook.com/business/help/274294333328345, accessed October 2026
- Meta Business Help Center, About ad auctions: facebook.com/business/help/430291176997542, accessed October 2026
- Meta Business Help Center, About creative fatigue recommendations in Meta Ads Manager: facebook.com/business/help/1346816142327858, accessed October 2026
- Meta for Business, “Simplifying Ad Measurement for a Social-First World”, 3 March 2026: facebook.com/business/news/click-attribution, accessed October 2026
- Google Ads Help, About Target ROAS bidding: support.google.com/google-ads/answer/6268637, accessed October 2026
- Google Ads Help, Multiply conversions with Performance Max (video figures from Google data, global, November 2022): support.google.com/google-ads/answer/11189316, accessed October 2026
- Amazon, “Amazon product videos” seller guide: sell.amazon.com, accessed October 2026
- NCSolutions, Five Keys to Advertising Effectiveness, August 2023: info.ncsolutions.com, accessed October 2026
- Gordon, B. R., Zettelmeyer, F., Bhargava, N. and Chapsky, D., “A Comparison of Approaches to Advertising Measurement: Evidence from Big Field Experiments at Facebook”, Marketing Science, 2019: kellogg.northwestern.edu, accessed October 2026
- DesignerBox plans and the video credit range: DesignerBox pricing page (designerbox.ai/pricing), October 2026
ROAS definitions and auction rules verified from Meta and Google help pages as of October 2026. Lift figures are each publisher’s own data. The ROAS and profit sums in this article are illustrative arithmetic. Individual results vary.