


Shopify store optimization is the work of removing what stops a visitor from buying. A store has three layers, and they only count in order. First the page has to load. Then the shopper has to be able to judge the product. Then the shopper has to be able to pay. Shopify’s own reports show which layer is failing, so a small team can audit all three in one afternoon.
A list of ten fixes with equal weight does not help a team of one to three people. This guide puts the fixes in an order and gives each layer a number to read. Every Shopify and Google rule here comes from their own documentation, read in October 2026.
Key Takeaways
A store has three layers. The page loads, the shopper can judge the product, and the shopper can pay.
Shopify measures layer one for you. Its web performance reports show three Core Web Vitals from real visitors, at the 75th percentile.
Google’s targets are 2.5 seconds, 200 milliseconds and 0.1. They apply to loading, response to input and layout movement.
The funnel report shows the failing layer. It counts sessions with cart additions, sessions that reached checkout and sessions that completed checkout.
Baymard’s documented average for cart abandonment is 70.22%. It is an average of 50 studies.
What is Shopify store optimization?
Shopify store optimization is a repeated audit of the path from the first page view to the paid order. You measure where visitors leave, change one thing at that point, and measure again. It covers the theme and the apps, the product pages, and the checkout settings. It does not start with traffic, because more traffic into a store that loses visitors costs more for the same result.
The useful question is narrow: where do visitors leave today? Shopify answers it in two places in the admin. One is the set of web performance reports. The other is the conversion rate breakdown.
The three layers of a Shopify store
Each layer has one question, one place to measure it and one kind of fix.
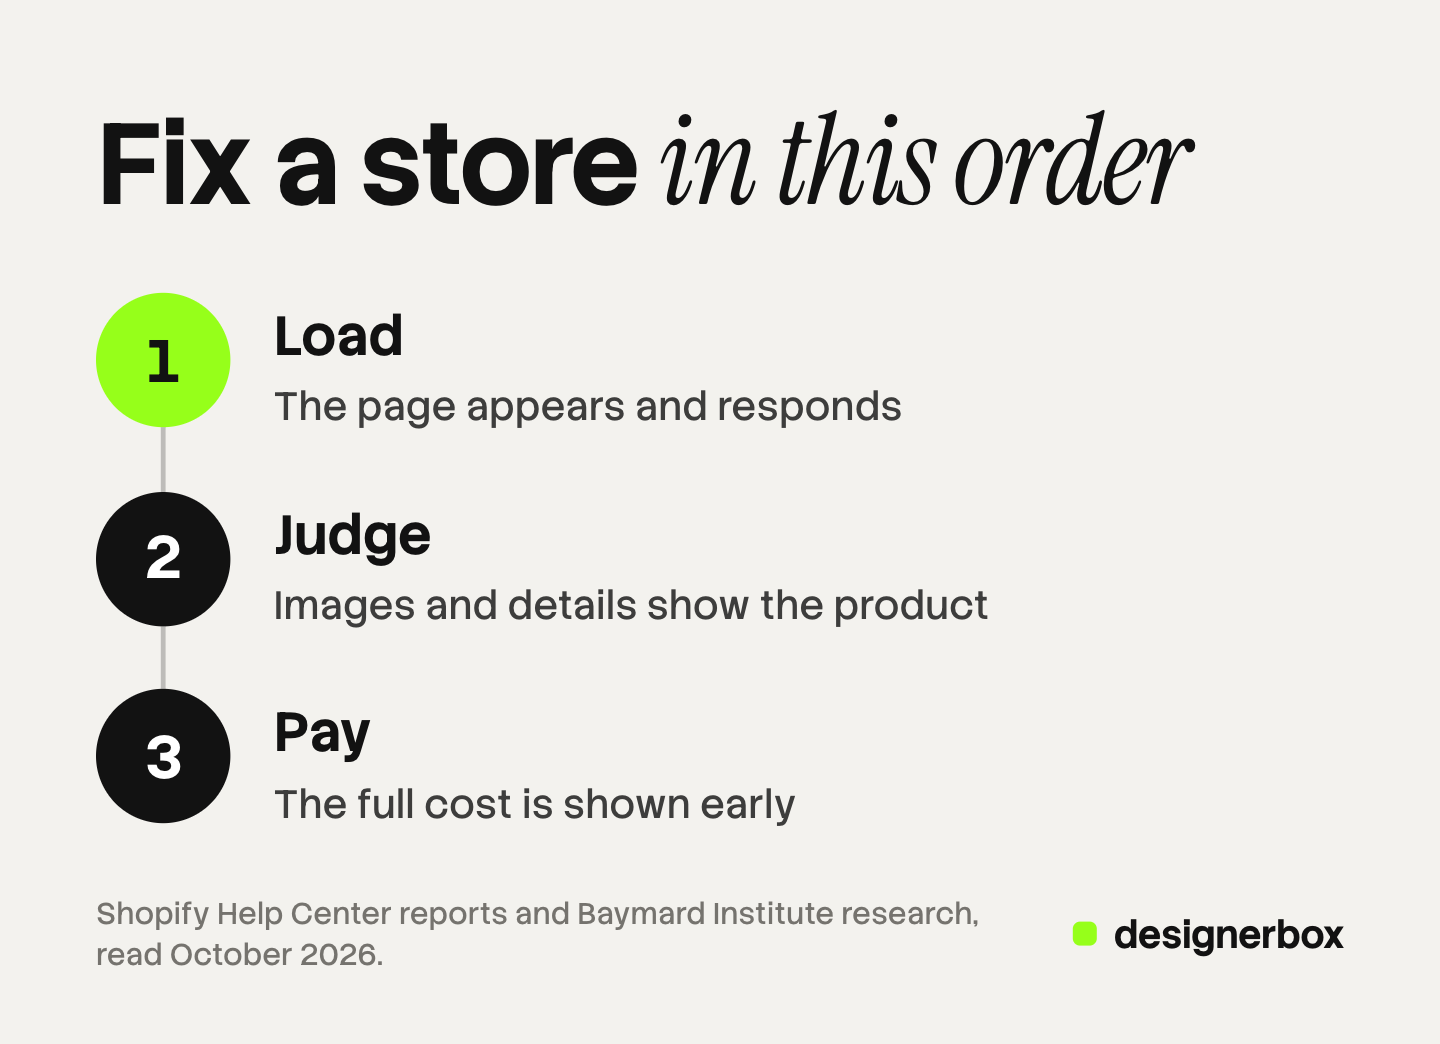
| Layer | The question | Where you measure it | The kind of fix |
|---|---|---|---|
| 1. Load | Does the page appear and respond? | Web performance reports | Theme, apps, third-party code, media |
| 2. Judge | Can the shopper tell what the product is? | Sessions with cart additions | Images, title, description, price, delivery details |
| 3. Pay | Can the shopper complete the order? | Reached checkout and completed checkout | Costs shown early, account rules, payment methods |
Each layer depends on the one before it. A shopper cannot judge an image that has not loaded. A shopper who cannot judge the product never sees the checkout. So you fix the first layer that fails, and you stop there until it passes.
Layer 1: does the page load?
Shopify speed optimization starts with a measurement you already have. In the admin, open Analytics, then Reports. The web performance reports show three Core Web Vitals for your store (help.shopify.com, October 2026).
Google defines the three metrics and sets a target for each (web.dev, October 2026).
| Metric | What it measures | Good | Poor, in Shopify’s report |
|---|---|---|---|
| Largest Contentful Paint | How fast the main content appears | 2.5 seconds or less | More than 4 seconds |
| Interaction to Next Paint | How fast the page responds to a tap or a click | 200 milliseconds or less | More than 500 milliseconds |
| Cumulative Layout Shift | How much the content moves while it loads | 0.1 or less | 0.25 or more |
The reports use data from real visitors, and they show the 75th percentile. That means three of every four visits were at least that fast. Google recommends the same percentile, measured for mobile and desktop separately.
Read the reports by page type and by device. The data covers the last 90 days and can be up to 36 hours late, so check again a few days after each change.
What you can change
Shopify already handles part of the work. It serves files from a content delivery network, compresses them, and often delivers images as WebP (help.shopify.com, October 2026).
Shopify names three things that you control: the theme, the apps you installed, and any third-party code you added by hand.
- Apps. List every installed app. Remove each one that no person on the team used in the last 30 days.
- Third-party code. Check for tracking tags and chat scripts left from old campaigns.
- Theme. Count the sections on the home page and the product page. Remove the ones that show nothing a shopper needs.
- Media. Check the size of the files you upload. The limits and the format Shopify delivers are in the guide to Shopify product image size, and the image audit is in the guide to Shopify image optimization.
Layer 2: can the shopper judge the product?
The shopper now has to decide whether the product is the right one. The number to read is the share of sessions that add a product to the cart.

If that share is low and layer one is good, the product page is the problem. Baymard Institute’s product page testing, reported in 2017, found that 56% of participants began with the product images, before they read anything else (baymard.com, October 2026). So the images are the first thing to check.
Open your five most visited product pages on a phone. For each one, answer these questions with yes or no.
- Is the product clear in the first image, at the size of a small thumbnail?
- Does one image show the product from a second side?
- Does one image show the size, next to a person or a known object?
- Does one image show the material up close?
- Does each color have its own image?
- Do all the products look like they come from the same store?
The last question is about the whole catalog, and the Shopify collection page is where you can see the answer. Our guide to Shopify product images shows each place the first image appears, and the guide to ecommerce branding covers how to set one look.
The price, the delivery cost and the return terms belong on the product page too. The field-by-field version of this check is in the guide to Shopify product page optimization. The order of the gallery is in the guide to PDP images that convert.
No source we read gives a reliable number for what better images add to a store’s sales. Measure your own add-to-cart share before and after the change.
Layer 3: can the shopper pay?
The third layer starts when a product is in the cart. Baymard Institute keeps a list of published cart abandonment studies. The average of the 50 studies on it is 70.22% (baymard.com, list updated September 2025, read October 2026).

In Baymard’s own survey, 42% of US online shoppers said they had left a cart because they were only browsing or not ready to buy. You cannot fix that group. The remaining reasons are the ones a store can act on.
| Reason a shopper gave for leaving | Share | What to check in your store |
|---|---|---|
| Extra costs too high (shipping, tax, fees) | 40% | Is the delivery cost visible before checkout? |
| Delivery was too slow | 20% | Is the delivery time stated on the product page? |
| Did not trust the site with card details | 19% | Are the store policies and contact details easy to find? |
| The site wanted an account | 18% | Does your store ask for an account before payment? |
| Checkout too long or complicated | 17% | How many fields does a new customer complete? |
| Not enough payment methods | 9% | Which payment methods appear at checkout? |
Showing the full cost early is the cheapest change in this audit.
On Shopify, you change these things on the Checkout settings page in the admin. Shopify also offers Shop Pay, which saves a customer’s email address, payment method and shipping details for the next order. It is part of Shopify Payments (help.shopify.com, October 2026).
To see the carts you lost, open Orders, then Abandoned checkouts. Shopify lists a checkout there when the customer entered an email address and did not complete the order. It deletes entries older than three months, and it can send a recovery email automatically (help.shopify.com, October 2026).
Shopify conversion rate optimization with the funnel report
Shopify conversion rate optimization is the same three layers, read from one report. Open Analytics, then Reports, and find the report called Conversion rate breakdown. Shopify lists it with the behavior reports (help.shopify.com, October 2026).
The report has three steps after the session count: sessions with cart additions, sessions that reached checkout, and sessions that completed checkout. Shopify divides each step by the total number of sessions. Here is an example with invented numbers.
| Step | Sessions | Share of all sessions | Layer it tests |
|---|---|---|---|
| All sessions | 1,000 | 100% | Layer 1 decides how many stay |
| Added to cart | 60 | 6% | Layer 2 |
| Reached checkout | 30 | 3% | Layer 3, the cart |
| Completed checkout | 18 | 1.8% | Layer 3, the payment |
In this example, 12 of the 30 sessions that reached checkout did not complete it. That is the step to work on.
Shopify’s blog cites two global averages: 1.4% of ecommerce visits in the first quarter of 2026, from Statista, and 2.66% from Dynamic Yield’s data on more than 400 brands (shopify.com, August 2026, read October 2026). One figure is almost twice the other. Shopify itself calls them a rough baseline. We found no dated, named measurement of an average for Shopify stores alone, so this guide prints none.
Compare your store with its own last 90 days. That is also how to increase Shopify sales without spending more on ads: find the step with the largest loss and repair it.
Search, after the three layers
Search work brings new visitors, so it comes after the three layers. One part of the audit already helps. Google recommends good Core Web Vitals for success with Search, and says they align with what its core ranking systems reward (developers.google.com, October 2026). Layer one covers them.
One extra check is in the behavior reports: the report of searches with no results. It covers the searches in your own store that found nothing.
Google can also list your products for free. The guide to Shopify Google Merchant Center covers that connection.
The afternoon audit, in order
Write each answer down, because the next audit compares against it. Make one change at a time, so you know what caused the result.
- Open the web performance reports. Record the three metrics for the product page type, on mobile.
- Stop here if any metric is poor. Remove unused apps and old scripts first. Check the reports again in a few days.
- Open the conversion rate breakdown. Record the three shares for the last 30 days.
- Find the largest loss. A low add-to-cart share points to layer two. A loss after the cart points to layer three.
- For layer two, run the six image questions on your five most visited products.
- For layer three, place a test order on a phone. Count the fields, and note where the delivery cost first appears.
- Choose one change. Make it, and write the date next to it.
- Repeat in 30 days. Compare the same numbers.
Product images for the second layer
Layer two is where most of the hours go, because a catalog needs the same set of images for every product. Anyone can make an AI picture. Making hundreds that still look like your brand is the hard part.
DesignerBox is AI creative production for brands and agencies. It makes images, ads and video with your brand. You build the image set once as a workflow. Your brand rules are saved once, and the workflow reads them on every run.
Batch runs that workflow over a sheet of up to 200 products, so row one and row two hundred get the same set. You keep or discard each result. The cost is shown before the run.
DesignerBox does not send finished work to Shopify. You download the results, or send them with a webhook or an S3 step, and then you upload them to your store. The guide to bulk uploading images to Shopify covers that step. The same product photo also feeds the next jobs: the full workflow from the first product photo to the finished ad, in one subscription.
Uploading your own photos and the commercial license start on the Pro plan. AI video, virtual try-on, upscaling, the image editor and the video editor start on the Premium plan. Plans and credits are on the pricing page.
There is a free plan, and it runs on sample products. Get started free.
FAQ
How do I optimize my Shopify store?
Check three layers in order. First read the web performance reports to confirm the pages load. Then read the share of sessions that add a product to the cart, and check the product images and details. Then read the checkout steps. Fix the first layer that fails before you move to the next one.
What is a good Shopify conversion rate?
There is no single reliable figure. Shopify’s blog cites global ecommerce averages of 1.4% from Statista and 2.66% from Dynamic Yield, and calls them a rough baseline. Compare your store with its own last 90 days.
Where does Shopify show the conversion funnel?
Open Analytics, then Reports, and find the Conversion rate breakdown report in the behavior category. It shows sessions with cart additions, sessions that reached checkout and sessions that completed checkout.
Why do shoppers abandon carts?
In Baymard Institute’s survey, 42% of US online shoppers had left a cart because they were only browsing. Among the other reasons, the most common was extra costs such as shipping, tax and fees, at 40%.
How often should I audit a Shopify store?
Once every 30 days is a workable rhythm for a small team. Shopify’s web performance data covers the last 90 days, so three audits fit inside one window. Make one change in each cycle, so you can tell what caused the result.
Sources
- Shopify Help Center, Web performance reports: the three metrics, the bands, real visitor data and the 90-day window, read October 2026.
- Shopify Help Center, Improving your online store performance: what Shopify handles and what the merchant controls, read October 2026.
- Google, Web Vitals: the targets for the three Core Web Vitals and the 75th percentile, read October 2026.
- Google Search Central, Understanding Core Web Vitals and Google search results, read October 2026.
- Shopify Help Center, Behavior reports: the conversion rate breakdown and the search reports, read October 2026.
- Baymard Institute, Cart abandonment rate statistics: the 70.22% average of 50 studies and the reasons for leaving, list updated September 2025, read October 2026.
- Baymard Institute, All Products Need at Least One “In Scale” Image: the 56% finding, published May 2017, read October 2026.
- Shopify Help Center, Shop Pay, Shopify Checkout and Recovering abandoned checkouts, read October 2026.
- Shopify, Ecommerce conversion rate benchmarks, published August 2026, read October 2026.
- DesignerBox pricing, October 2026.
Shopify and Google rules verified from their own documentation as of October 2026, and checkout statistics from Baymard Institute’s published research. Platform reports and settings change often. Individual results vary.